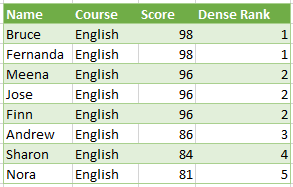
There are several ways to rank things, dense ranking is when items that compare equally receive the same ranking number, with subsequent items receiving the next ranking number, with no gaps between numbers, like this:
Download the Excel Workbook and Queries in This Post
The queries in this Excel file can be copied/pasted into the Power BI Desktop Advanced Editor and will work there too.
Enter your email address below to download the workbook with the data and code from this post.
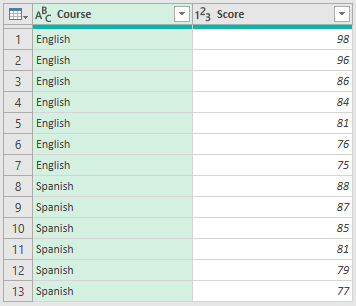
I have some data in an Excel table for students who are studying Spanish or English. They've just taken exams and I'm going to use Power Query to create a dense ranking for the scores they received in those exams.
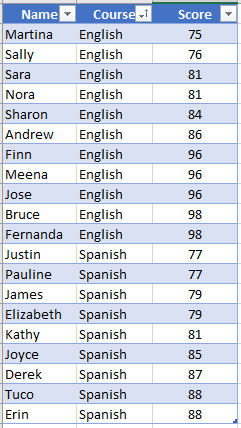
I'm going to use two queries to load the table of data. The first query called Scores just gives us the same 20 row table, sorted first by Course (ascending) and then by Score (descending).
The 2nd query is called Ranks and this is where most of the work is done. After loading the same source table, the first thing to do is remove all columns except Course and Score.
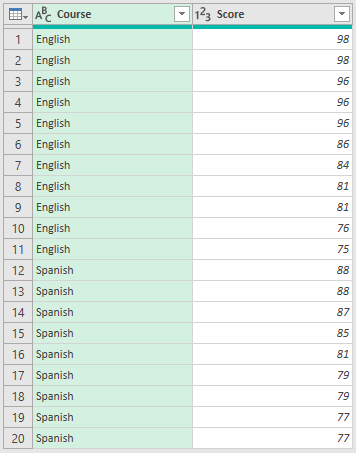
Then remove duplicates in the Score column
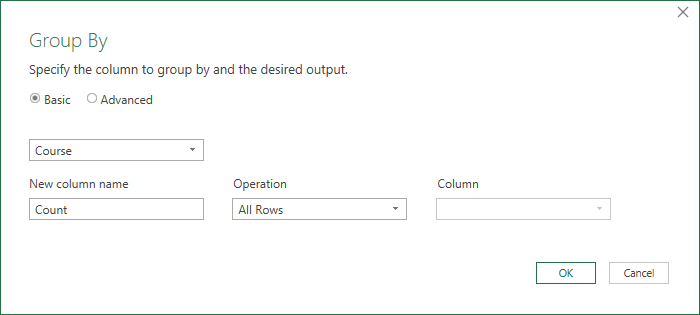
Next, Group By the Course column
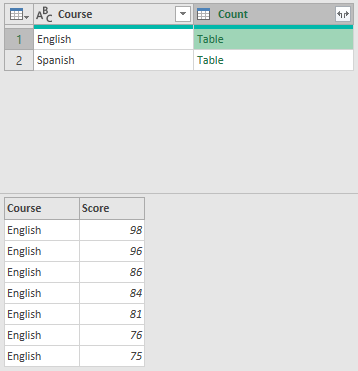
To give us a table with two rows, one for each course. Each row in the Count column contains a table that contains all the scores for that course.
Now the best part, by adding a Custom Column and using this to add an Index Column to each item in the Count column, because each item is a table of scores for that course,
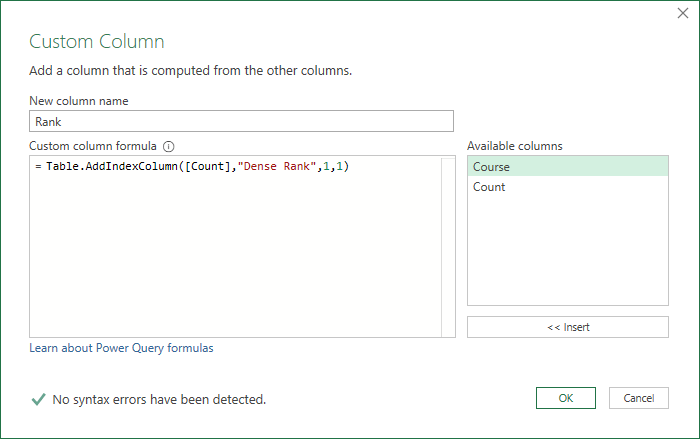
you end up with another table in each row of the new custom column (called Rank) that has assigned a ranking (index) to every score for each course.
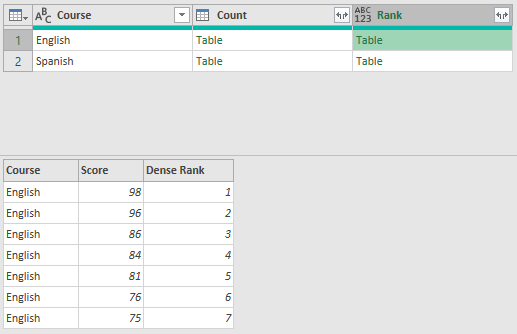
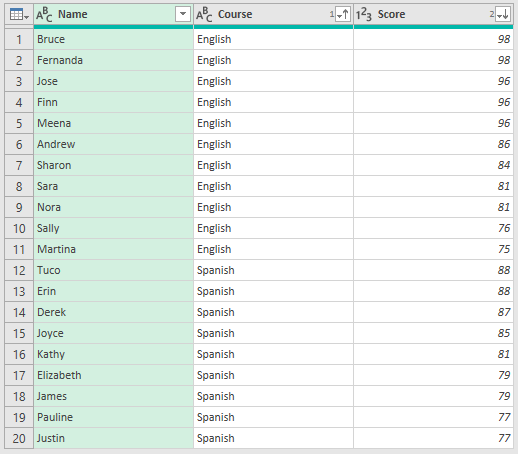
Now by expanding the tables in the Rank column you end up with this, a table with each score in each course ranked.
![]()
There are only 13 rows in this table but we have 20 rows in our source data so we need to merge (join) the Scores and Rank tables together into a new query
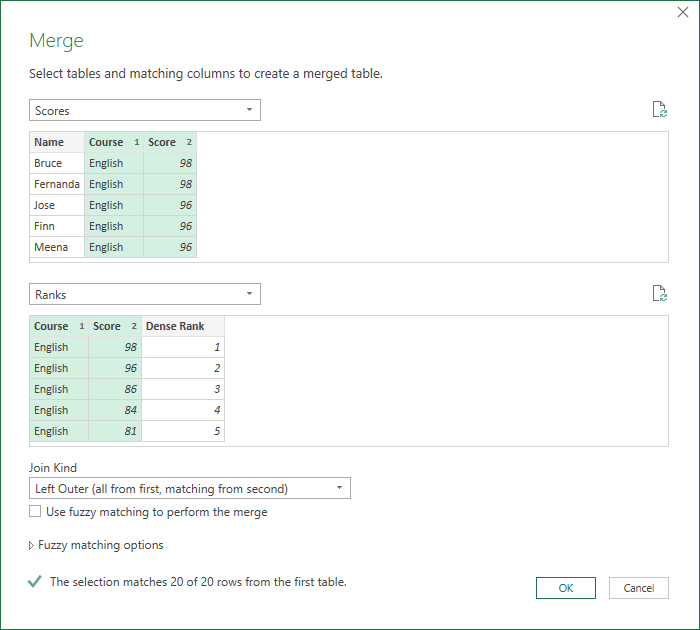
The result is a table in every row of our new query that includes the rank for that combination of Course and Score.
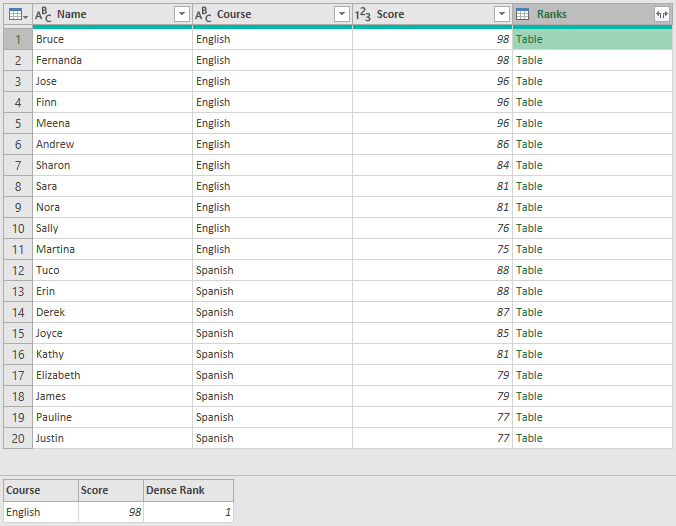
Expanding the column of tables gives this
Can you see the problem? All the ranks are wrong.
So what is going on? I'm not 100% sure. I've read several blog posts and articles where similar issues are described, and I've seen this same kind of problem occur with sorting and removing duplicates.
My understanding is that Power Query presents one view of how data is stored, as in the end result of the Ranks query above, but it actually stores it in another way/order.
This does seem odd but the explanation I've seen given is that PQ uses lazy evaluation - it only really evaluates something when it is actually needed. So as you are going through building a query with various steps, the data you see in the preview isn't necessarily the data you're going to get when you run the query for real.
I'm not convinced that this is desirable behaviour, but the solution appears to be to use Table.Buffer. Table.Buffer takes a table and stores it in memory after evaluating it. This seems to be the key point.
As you add steps to your query, and as that query is run, each step is evaluated and the data in the step may be evaluated many times. What does it mean to evaluate? It means PQ checks the data to see what it is. But there appears to be no guarantee that the data is stored in an expected, ordered state.
You could sort a list but in a subsequent step that sorting is lost. Or as we have here, we've created a ranking that isn't applied correctly, even though when you examine the table in the Ranks column, it shows you the correct rank.
![]()
What is really puzzling is that as the query is doing a merge, it is matching up two columns, the Course and the Score, so shouldn't it follow that the Dense Rank value in that row in the Ranks table should be correct?
The fact that it isn't would imply that the join isn't working properly. If the join can attach the correct Course and Score from the Ranks table to the Scores table, why is the Dense rank value wrong?
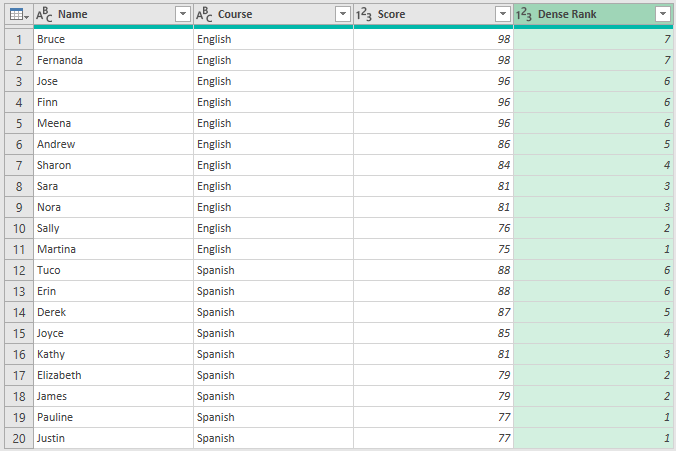
Anyway, the fix is to wrap the Ranks table in Table.Buffer inside the join step.
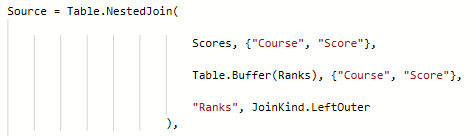
Buffering the table like this means the table is held in computer memory in a known state. The query evaluates Ranks once and then does not evaluate it again. The order of the elements in the table won't change.
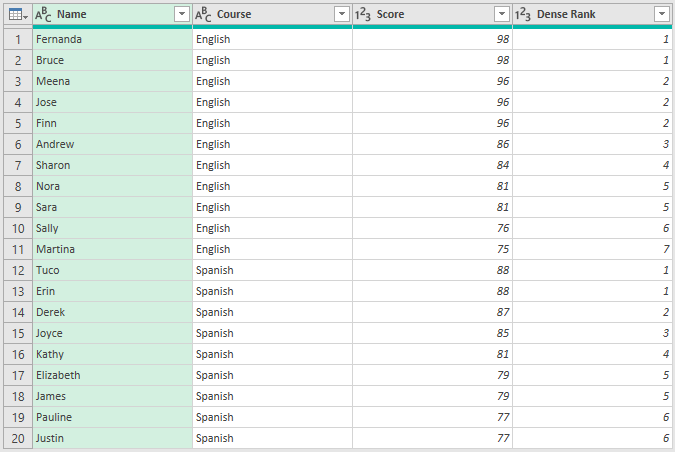
With Table.Buffer in place, the result of the join is now correct.
We might have to ask Microsoft what is actually going on here.


Hi guys!
A tip for the problem of the wrong ranking with merge, and to use just one query instead of two.
In a query with all columns you need in the result, without drop any of this column, follow the tutorial in steps to group by and to add a custom column.
After that, just drop the column that you use to group (in example is “course”) and “count”. Now you just need to expand the column rank 🙂
Hi Alec,
When I try this I get rankings from 1 to 11 for English and 1 to 9 for Spanish. But I was trying to achieve Dense Ranking where scores that are the same are ranked the same e.g. all scores of 96 in English are Rank 2, but I get Ranks 3, 4 and 5 using your approach.
Regards
Phil
I managed to solve this in one step:
Add Custom Column,
= Table.AddColumn(
Source,
“Dense Rank”,
each
let
row = _
in
List.Count(
List.Distinct(
Table.SelectRows(Source, each ([Course] = row[Course] and [Score] >= row[Score]))[Score]
)
)
)
Great work!
Phil
HI Philip, thanks for the post and the interesting findings.
That’s super weird as when we “preview” the content of the merged Table before expanding, it shows the correct ranking.
I’ve tried using your sample file two different approach to solve this:
1) Instead of using “Group By”, I created two helper queries, one for “English” and one for “Spanish”. Then do the sorting and adding index column as normal; append the two tables, then do the Left Outer Join. It works. Downside: not efficient when we have many courses.
2) Using the Group by. The trick here is to do the sorting AFTER Group By. That is, I have two steps of adding custom columns. The first one is sort the “Grouped” table by score; the second one is to add index column to it. Then the Left Outer Join works as expected.
Honestly, I am not sure why it works this way. I guess if it is something related the “multi-sorting”.
To echo your conclusion. Ask Microsoft. 🙂
p.s. May I used your sample file to write a blogpost / make a video to show my suggested solution?
Hi MF,
Yes it’s a puzzle and all we’ve come up with yet are workarounds.
Yep no probs using the sample file, just please mention me and link back here.
Thanks
Phil
Sure. Will let you know when it’s ready. 🙂
Hi Philip,
Thanks again for allowing me use the sample file.
Here’s the video:
https://youtu.be/A9wtuu2u0VA
And the blogpost:
https://wmfexcel.com/2020/12/12/dense-ranking-with-power-query-unexpected-behavior-and-workarounds/
Comments are welcome.
Cheers,
No worries 🙂
Many thanks for helping out solving this strange phenomena in PQ …
Best regards
Marcus
Glad to help Marcus.
Regards
Phil
Hi – a formulaic approach to the dense-ranking question, where the course name field is named Course and the scores are range-named Scores:
Thanks,
Abbott Katz
Nice, Abbott! Thanks for sharing. Here is your formula with structured references to the table in the file for this post:
Mynda
Thanks Philip for this blog, it piqued my interest! It truly is puzzling that the data preview of the table gave the correct results but the expand rows did not. What happens between those two steps? So bizarre, it must be recalculating the Ranks table, but I’m not quite sure based on what. Interesting that it just gives the reverse ranking.
My solution would have been a bit different to yours, though also using Table.Buffer: I tell my students to be careful with Power Query sort – I find it depends on the data source to some extent, and with Power Query loading only a preview of the data it can’t guarantee accurate sorting in the final result. If you want the sorting to stick, use a Table.Buffer at the sort step. So in your example if you put a Table.Buffer around the Sort step in your Ranks table and remove the Table.Buffer in your Dense Ranked Scores table, you also get the desired result. I’m not sure which one is more efficient, in this example I don’t think it matters but in a more complex solution where Ranks could potentially be referenced by other queries I prefer to buffer it at the source table.
Hi Allison,
Thanks for visiting, have seen your posts over at PBI Community 🙂
Thanks for your solution, this behaviour is definitely a head scratcher and certainly not desirable from my stand point.
We’ve had feedback from other MVP’s all with workarounds but the underlying behaviour remains. I hope Microsoft can address this asap.
Regards
Phil
The downloaded Excel spreadsheet’s query results shows only 13 records, instead of 20, as your instructions indicate. Could you please revise the spreadsheet/query and re-post?
Also, in the 3rd paragraph in the instructions above, queries is misspelled as queires.
Hi Joan,
Thanks for spotting the typo.
The result of the Dense Ranked Scores query definitely returns 20 rows. Its output is the green table on the Dense Ranking sheet. This is the only query that creates a table in Excel.
The intermediate query named Ranks only has 13 rows because it only includes unique combinations of Course and Score.
Regards
Phil