2024 was a groundbreaking year for Excel updates, bringing a wealth of new features designed to elevate productivity. But with so many new tools, which ones truly make a difference? Let's explore some of the most impactful updates that can set you apart in 2025.
Note: as these are new features, most of them will require Microsoft 365.
Table of Contents
Watch the Best New Excel Features Video

Get the Example File
Enter your email address below to download the sample workbook.

Checkboxes: Track Tasks with Ease
After nearly 40 years, Excel has upgraded checkboxes, and they're fantastic for task management! Imagine a chores list for your kids; with these checkboxes, you can keep track of completed tasks without any disputes.
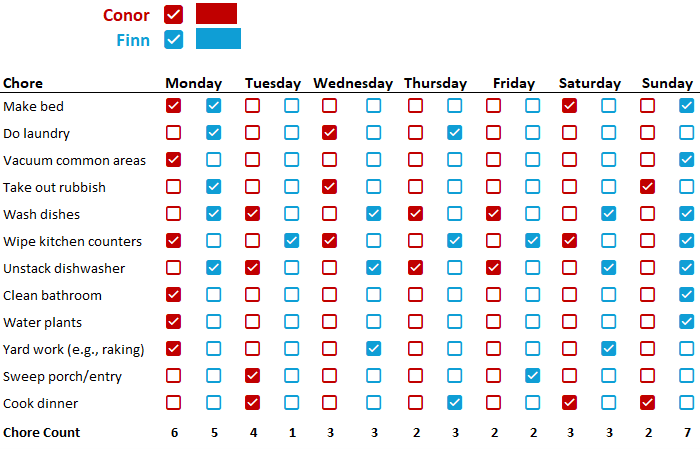
Adding Checkboxes: Go to Insert > Checkbox. Simply select your cells, click "Checkbox," and you're set.
Customizing Checkboxes: You can colour-code checkboxes using the font formatting tools.
Tip: Since checkbox cells contain TRUE/FALSE values, you can use formulas like
=COUNTIF(range, TRUE)
to calculate completed tasks or
=COUNTIF(range, FALSE)
to count tasks yet to be completed.
Use these values with conditional formatting to visualize progress and perhaps add a bit of friendly competition!
More Checkbox Examples: If you want more practical ways to use checkboxes in Excel, check out my tutorial dedicated to checkboxes.
Copilot: AI-Driven Assistance
Copilot has come a long way from its early days, providing more robust, intelligent solutions.
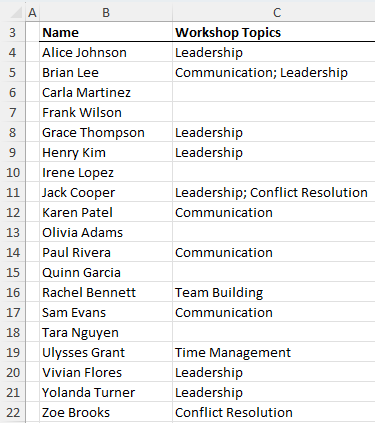
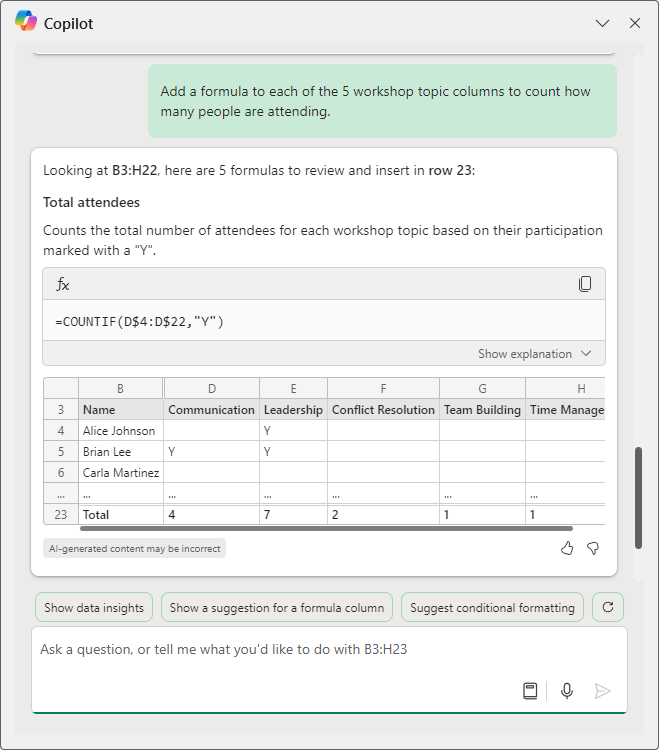
Example Task: If you have a list of employees and multiple workshop topics, Copilot can create separate columns for each workshop and indicate attendance with a simple "Y".
Prompt: "Create columns for each workshop topic and flag attendees with Y." Copilot then drafts a solution, and with a preview available, you can approve it with a single click.
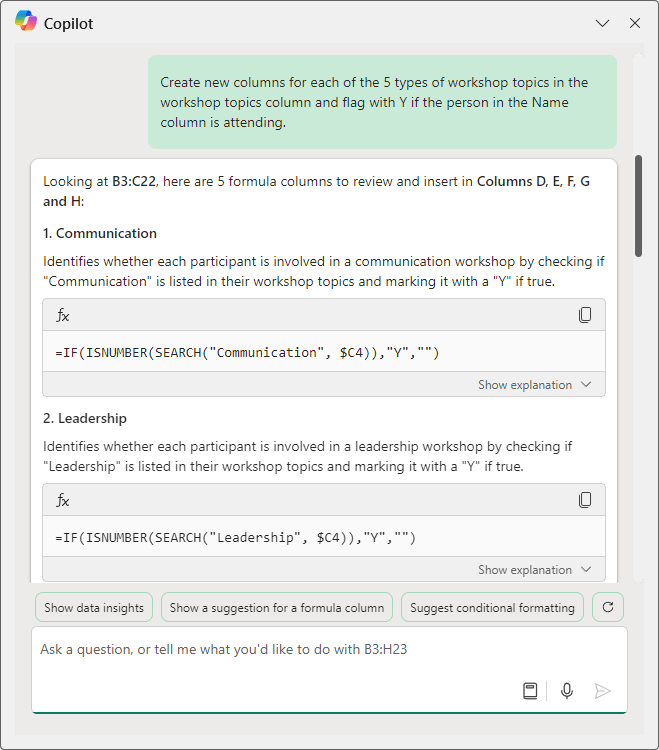
The result is 5 new columns added with formulas automatically inserted:
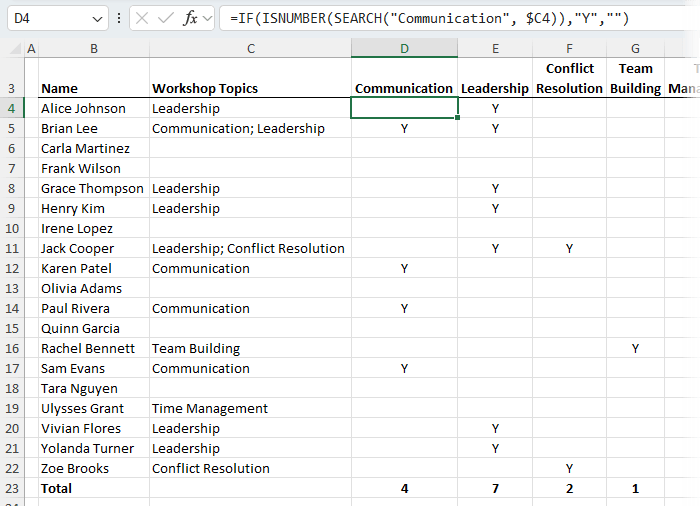
Continue Conversation: It might also be nice to add a total row. With a simple prompt, Copilot not only adds the total row, but it includes a new row label and formats the font in bold.
With these upgrades, Copilot feels like having a personal assistant in Excel — streamlining tasks and improving your workflow.
SCAN Function: Dynamic Running Totals
The SCAN function introduces a seamless way to manage running totals without having to constantly adjust your formulas.
Traditional Method: Running totals previously required a formula with expanding ranges like
=SUM($C$5:C5)
but these needed manual updates as data grew.
New Approach: SCAN allows you to define an initial value (e.g., 0) and dynamically adjust for new entries. Using the below formula, SCAN updates automatically as you add data.
=SCAN(0, range, LAMBDA(i,v,IF(v<>"",i+v,"")))
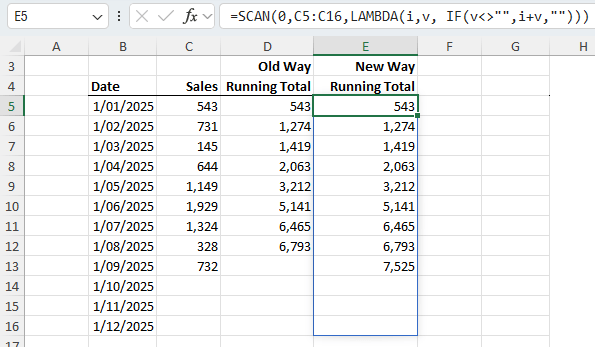
This eliminates the need for repetitive adjustments and ensures you always have accurate running totals.
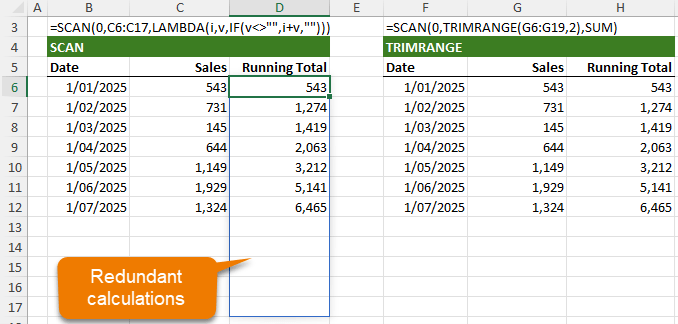
TRIMRANGE: Manage Dynamic Ranges Easily
The TRIMRANGE function redefines how you work with dynamic ranges, trimming empty rows for better performance and easy dynamic ranges.
Why Use TRIMRANGE? It replaces complex dynamic named ranges requiring OFFSET, INDEX or INDIRECT, making it easier to handle large data sets without empty cell issues.
TRIMRANGE example: By combining TRIMRANGE with SCAN, you can create dynamic arrays without blank rows. Use the below formula for streamlined calculations that only consider cells with data.
=SCAN(0, TRIMRANGE(range, 2), SUM)
Notice we can also replace the complex LAMBDA with SUM, which is a simpler eta lambda that Excel recognises.
Tip: consider replacing SUM with AVERAGE or MAX.
In the image below you can see that when using TRIMRANGE, SCAN only returns results for the rows with data, whereas the SCAN formula without TRIMRANGE returns a load of empty redundant results:
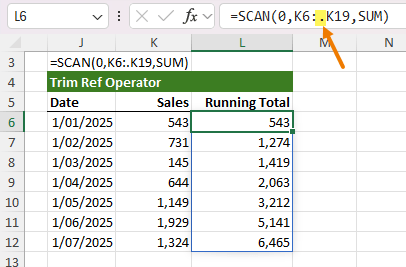
Trim Ref Dot Operator: An alternative to TRIMRANGE, the trim ref dot operator which allows for even simpler dynamic range management. Placing a dot after the semicolon in the range reference tells Excel to trim empty rows from the end of the range:
Effortless and efficient, TRIMRANGE is a must-know function for managing dynamic data.
There's more to the TRIMRANGE function and trim ref dot operator covered in my comprehensive TRIMRANGE function tutorial.
Focus Cell: Navigate Large Sheets Effortlessly
Finding your place in large sheets can feel overwhelming, but Excel's new Focus Cell feature helps you stay on track.
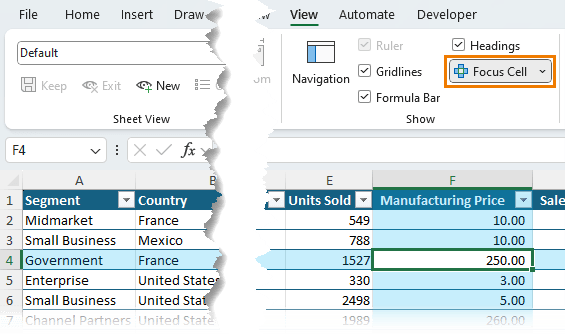
Activate Focus Cell: go to View > Focus Cell or use the keyboard shortcut Alt + W + E + F.
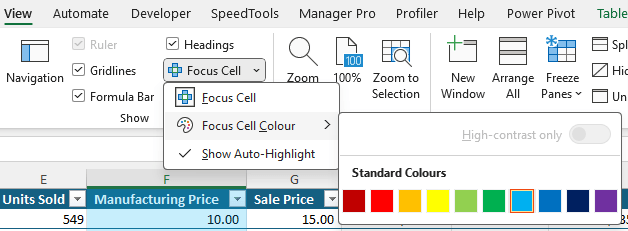
Customize Focus Cell: You can adjust the highlight colour:
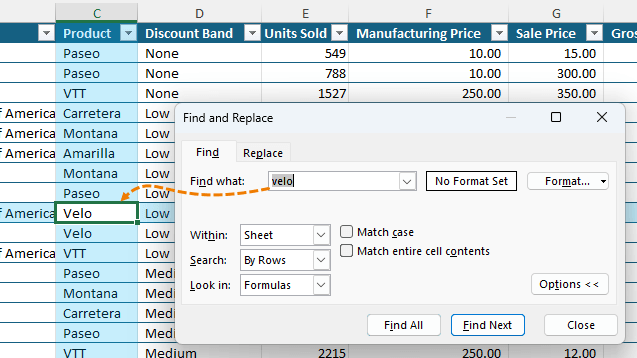
Highlight Find Cells: enable auto-highlight to stay oriented, even while using the Find tool with the ‘Show Auto-Highlight' setting:
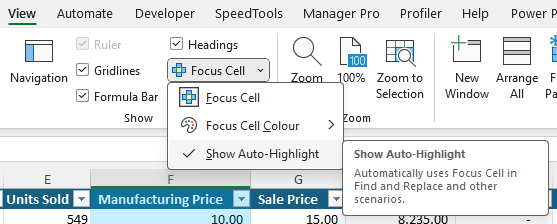
When this is enabled, the focus cell is applied to the cell containing the search term:
A much-needed feature, Focus Cell keeps you focused and organized in complex worksheets.
New Excel Features - Honourable Mentions
Python Integration in Excel: Unlock Advanced Data Analysis
Python integration in Excel is a game-changer for data analysis, bringing a powerful programming language directly into Excel's familiar environment. This feature allows users to execute Python code alongside standard Excel formulas, enabling complex data manipulations, machine learning, and advanced analytics without switching between applications.
Getting Started: This feature is particularly useful for advanced Excel users who want to start incorporating data science techniques.
If you're interested, check out my comprehensive Python in Excel tutorial to see how Python can elevate your data work.
REGEX Functions: Simplify Text Manipulation
Excel's new REGEX functions make it easier than ever to perform complex text searches, modifications, and extractions. REGEX, or regular expressions, allows users to handle text strings more flexibly, ideal for cleaning data or extracting specific patterns.
If you're interested, check out my Excel REGEX functions tutorial.
Next Steps
If you're ready to take your Excel skills even further, explore my Advanced Excel Formulas Course designed to fast-track your mastery of Excel's most powerful tools.

Thank you so much for highlighting the focus cell feature. It is so useful when searching complex spreadsheets.
Great to hear, Jim!
Neat article. Guessing this is slightly obvious but presumably Scan and Trimrange use data (non-blank) cells within the range specified, i.e. data outside the range is ignored.
Not so obvious, what happens if there are non-contiguous data ranges in the range specified? Presumably only the first/last contiguous range is used.
rgds
You can’t reference a non-congtiguous range.
I don’t think you can’t use AVERAGE directly with SCAN. For example, if values 1,2,3,4 populate A1:A4, the running averages should exhibit 1, 1,5, 2, 2,5 but this formula:
=SCAN(1,A1:A4,AVERAGE) (I’m starting with 1 because we don’t want a 0 to contribute to the average) will yield
1, 1.5, 2,25, 3.125
That’s because SCAN always averages only 2 values – the current value of the accumulator and the next value. Thus, you need a workaround, something like
=SCAN(0,A1:A4,SUM)/SEQUENCE(COUNT(A1:A4))
Yes, good point, Abbott. Thanks for sharing the workaround.