
Most people choose their hourly rate by guessing, copying competitors, or picking a number that "feels right".
The problem is that your hourly rate needs to cover much more than the hours you spend with clients.
It also needs to cover:
- Your desired take-home income
- Business expenses
- Tax
- Retirement or superannuation savings
- Non-billable time
- Holidays, sick leave and quiet periods
That's why Excel is such a useful tool for pricing service-based work. Instead of guessing, you can build a simple pricing calculator that shows the hourly rate you need to charge, how much billable time you need, and whether your income goal is realistic.
In this tutorial, we'll build an Excel pricing calculator for hourly services. We'll calculate the required hourly rate:
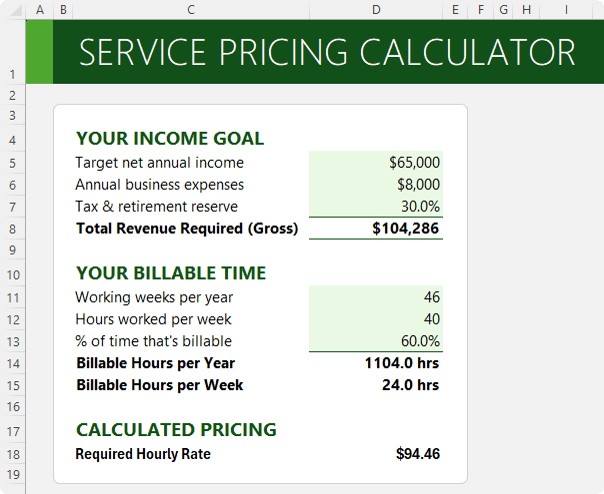
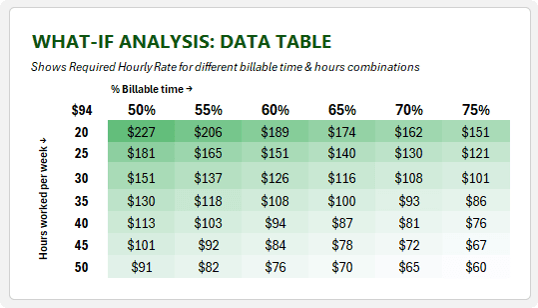
Use a What-If Analysis Data Table to compare different scenarios:
And use Goal Seek to work backwards from a target result:
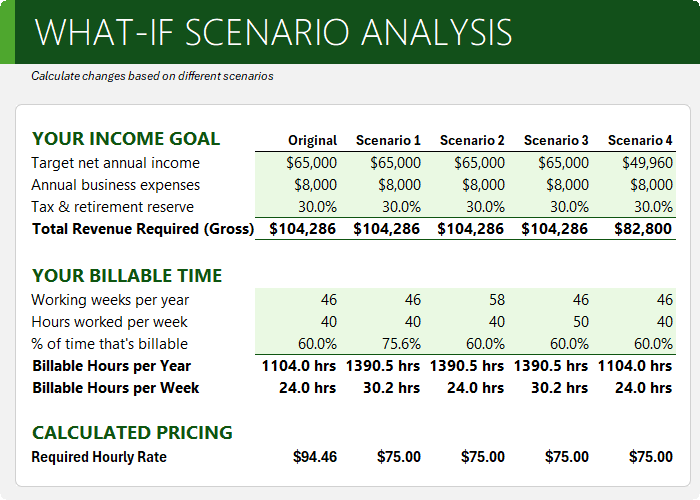
Table of Contents
- Watch the Excel Pricing Calculator Video
- Get the Excel Pricing Calculator File
- What the Excel Pricing Calculator Does
- Step 1: Enter Your Income Goal
- Step 2: Calculate the Total Revenue Required
- Step 3: Estimate Your Billable Time
- Step 4: Calculate Annual Billable Hours
- Step 5: Calculate the Required Hourly Rate
- Why Your Assumptions Matter
- Step 6: Use a What-If Analysis Data Table
- Step 7: Create the Data Table in Excel
- Step 8: Add Conditional Formatting
- Step 9: Use Goal Seek to Work Backwards
- Key Takeaways
Watch the Excel Pricing Calculator Video

Get the Excel Pricing Calculator File
Enter your email address below to download the free file.

What the Excel Pricing Calculator Does
The pricing calculator is designed for freelancers, consultants, contractors, coaches, bookkeepers, designers, virtual assistants, developers, and other service-based businesses that charge by the hour.
The model helps answer questions like:
- What hourly rate do I need to charge to reach my income goal?
- How many billable hours do I need each year?
- What happens if I work fewer hours per week?
- What happens if only 50% of my time is billable?
- Can I still reach my target income if the market only supports a certain hourly rate?
- What income is realistic under my current constraints?
The finished workbook has three main parts:
1. A service pricing calculator for entering assumptions and calculating the required hourly rate.
2. A What-If Analysis Data Table for comparing different combinations of weekly hours and billable time.
3. A Scenario Analysis section where Goal Seek works backwards from a target hourly rate.
Step 1: Enter Your Income Goal
Start with your target net annual income.
This is the amount of money you want to have left after allowing for tax, business expenses and retirement savings.
For this example, we'll use:
| Input | Value |
|---|---|
| Target net annual income | $65,000 |
| Annual business expenses | $8,000 |
| Tax and retirement reserve | 30% |
Business expenses might include things like software, insurance, professional fees, subscriptions, equipment, training, marketing costs and website expenses.
The tax and retirement reserve is the percentage of revenue you want to set aside for tax and retirement savings. In this example, we'll use 30%, but you should use a rate you're comfortable with.
Step 2: Calculate the Total Revenue Required
To calculate the total revenue required, take your target net annual income, add your business expenses, then gross it up for the tax and retirement reserve.
The formula is:
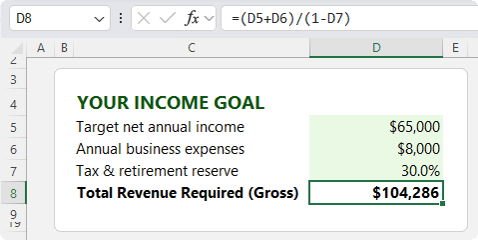
=(Net Income + Business Expenses) / (1 - Tax and Retirement Reserve %)
Using the example values:
=($65,000 + $8,000) / (1 - 30%)
This gives total required revenue of just over $104,000.
That means if you want to end up with $65,000 after expenses and setting aside 30% for tax and retirement, your business needs to generate around $104,000 in revenue:
Step 3: Estimate Your Billable Time
Next, calculate how many billable hours you have available each year.
This is where many pricing mistakes happen.
If you work 40 hours a week, that does not mean you have 40 billable hours a week. Some of your time will be spent on admin, marketing, quoting, emails, training, bookkeeping, planning and client communication.
For this example, we'll use:
Working weeks per year: 46
Hours worked per week: 40
The 46 working weeks allows for holidays, sick leave, public holidays and other time away from work.
The 60% billable time assumption means 60% of your working hours are charged to clients, while the remaining 40% is spent on non-billable work.
Step 4: Calculate Annual Billable Hours
To calculate annual billable hours, multiply:
Working Weeks x Hours Worked Per Week x Billable Percentage
Using the example values:
=46 x 40 x 60%
This gives 1,104 billable hours per year.
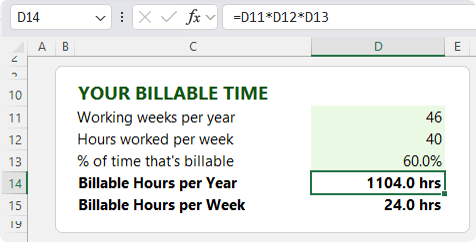
You can also calculate weekly billable hours by dividing annual billable hours by working weeks:
=1,104 / 46
That gives 24 billable hours per week.
This is often a more useful number because it makes the assumption easier to sense-check. If you plan to work 40 hours a week and bill 24 of those hours to clients, the remaining 16 hours are available for admin, marketing, meetings, quoting and other non-billable tasks.
Step 5: Calculate the Required Hourly Rate
Now you can calculate the hourly rate required to reach your income goal.
The formula is:
=Total Revenue Required / Annual Billable Hours
Using the example numbers:
=$104,285.71 / 1,104
This gives a required hourly rate of approximately $94.46.
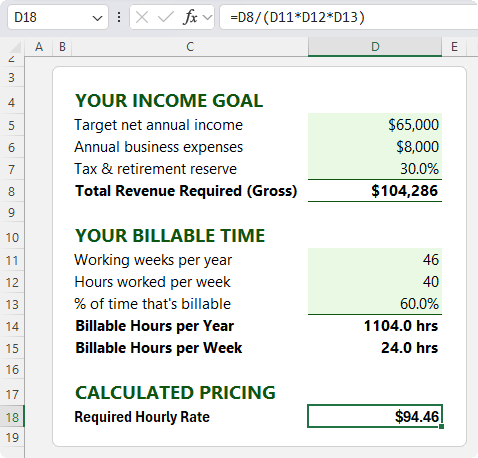
That means, based on the assumptions in the model, you would need to charge around $94.46 per billable hour to achieve a $65,000 net income after expenses and setting aside 30% for tax and retirement.
Why Your Assumptions Matter
The calculated hourly rate is only as useful as the assumptions behind it.
For example, the model assumes:
- 46 working weeks per year
- 40 working hours per week
- 60% billable time
But what happens if your billable time drops to 50%?
What if you can realistically only work 35 hours per week?
What if you become more efficient and increase billable time to 70%?
These changes can significantly affect the hourly rate you need to charge.
That's where Excel's What-If Analysis tools become useful.
Step 6: Use a What-If Analysis Data Table
A What-If Analysis Data Table lets you compare multiple scenarios side by side.
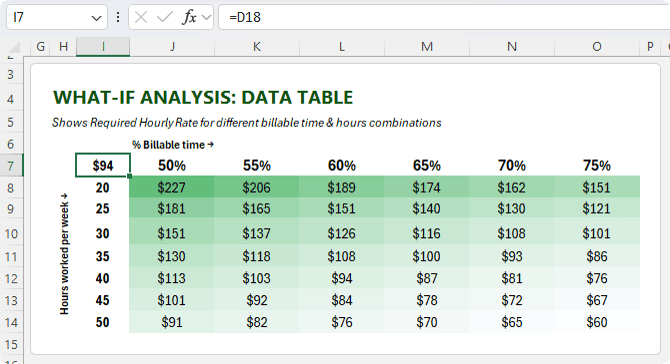
In this pricing calculator, the two most important variables are:
1. Hours worked per week
2. Percentage of time that is billable
A two-variable Data Table can show how the required hourly rate changes as those two assumptions change.
For example, across the top of the table, enter different billable percentages.
Down the side of the table, enter different weekly working hours.
At the top-left corner of the Data Table, reference the cell that contains the required hourly rate formula.
For example:
=D18
This tells Excel which result you want to calculate across the different combinations of hours and billable percentages.
Step 7: Create the Data Table in Excel
To create the Data Table:
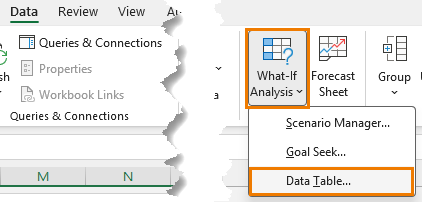
1. Select the full table range, including the row and column labels.
2. Go to the Data tab.
3. Select What-If Analysis.
4. Choose Data Table.
5. For the Row input cell, select the billable percentage input cell.
6. For the Column input cell, select the hours worked per week input cell.
7. Click OK.
Because the billable percentages are across the row, the Row input cell should point to the billable percentage input.
Because the weekly hours are down the column, the Column input cell should point to the hours worked per week input.
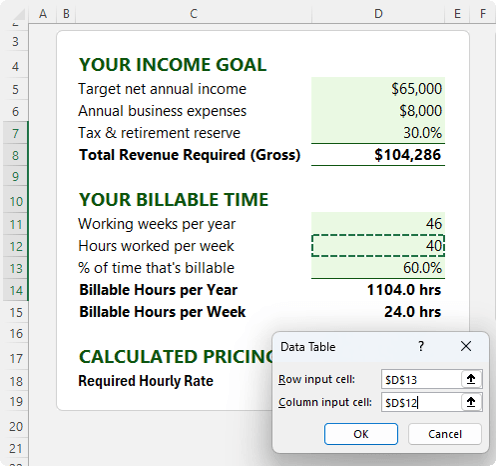
Excel then calculates the required hourly rate for every combination in the table.
Important Data Table Formula Tip
The formula referenced by the Data Table (from in cell I7 to D18 in this example) must depend on the input cells you are testing.
In this example, the required hourly rate formula should directly or indirectly reference:
- Working weeks per year
- Hours worked per week
- Billable percentage
That is why it is useful to write the required hourly rate formula in a way that clearly references the input cells used in the model.
If the row or column input cells are not connected to the formula, the Data Table will not return meaningful results.
Step 8: Add Conditional Formatting
Once the Data Table is created, add conditional formatting to make the results easier to interpret.
A colour scale works well because it helps you quickly see which combinations require a higher or lower hourly rate.
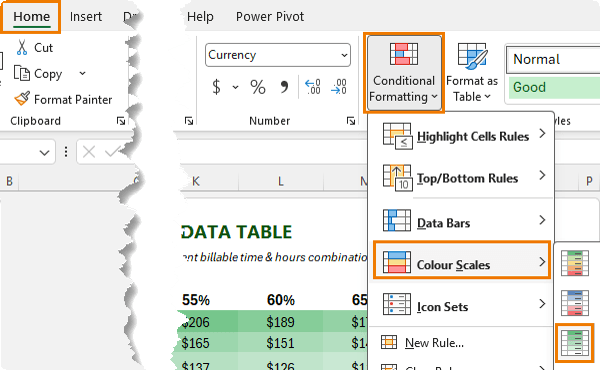
For example, you can use the Data Table to answer questions like:
- If I only want to work 30 hours a week, what hourly rate do I need at different billable percentages?
- If the market will not support a rate above $108, which combinations of hours and billable time make my income goal realistic?
- How much does my required hourly rate change if my billable time drops from 60% to 50%?
- What combination of hours and billable time gives me the lowest sustainable hourly rate?
This turns the calculator from a single result into a decision-making tool.
Step 9: Use Goal Seek to Work Backwards
The Data Table is useful when you want to compare many scenarios.
Goal Seek is useful when you know the result you want and need Excel to find the input required to get there.
For example, suppose your pricing calculator says you need to charge $94.46 per hour, but the market only supports $75 per hour.
You can use Goal Seek to ask questions like:
- What billable percentage do I need if I can only charge $75 per hour?
- How many working weeks would I need?
- How many hours per week would I need to work?
- What income is actually realistic if $75 per hour is the maximum rate?
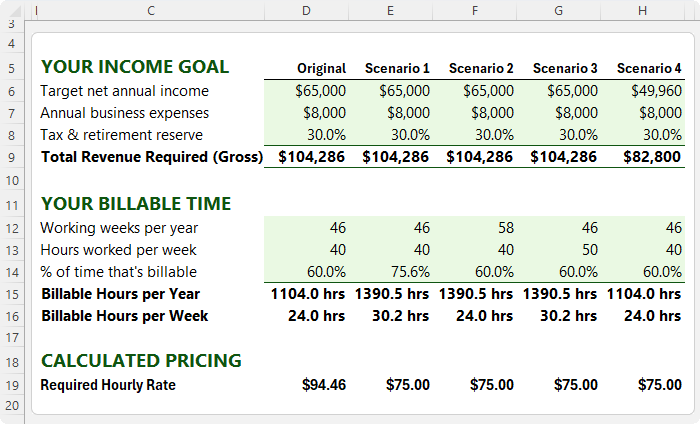
Scenario 1: What Billable Percentage Is Needed?
Suppose you can only charge $75 per hour, but you still want to earn $65,000 net income.
You can use Goal Seek to find the billable percentage required.
To do this:
1. Select the required hourly rate cell.
2. Go to the Data tab.
3. Select What-If Analysis.
4. Choose Goal Seek.
5. Set the required hourly rate cell to 75.
6. Set the changing cell to the billable percentage input cell.
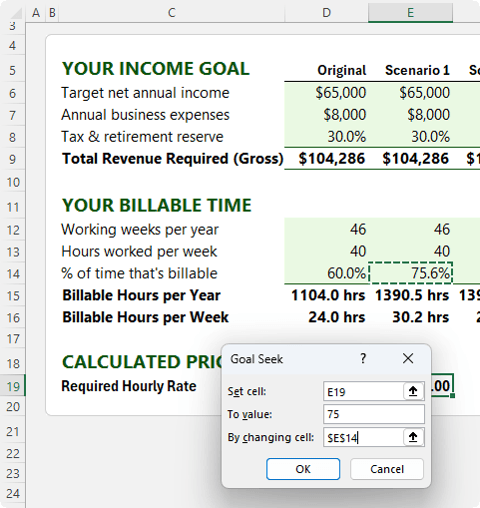
7. Click OK.
Excel works backwards and finds the billable percentage needed to make the hourly rate equal $75.
In this example, the result is approximately 75.6% billable time.
That means if you want to earn $65,000 and can only charge $75 per hour, you need to bill clients for just over three-quarters of your working time.
That might be realistic for some businesses, but for others it could be a stretch.
Scenario 2: How Many Weeks Would You Need to Work?
Next, suppose you keep the hourly rate capped at $75 and ask Excel how many weeks you would need to work each year to earn $65,000.
In Goal Seek:
1. Set the required hourly rate cell to 75.
2. Set the changing cell to the working weeks per year input cell.
In this example, Excel returns 58 working weeks.
That result is not practical because there are only 52 weeks in a year. Even working all 52 weeks would leave no time for holidays, sick leave, public holidays, downtime or quieter periods.
This tells you that the problem cannot be solved simply by working more weeks.
Scenario 3: How Many Hours Per Week Would You Need?
Now suppose you keep the hourly rate capped at $75 and ask Excel how many hours per week you would need to work.
In Goal Seek:
1. Set the required hourly rate cell to 75.
2. Set the changing cell to the hours worked per week input cell.
In this example, Excel returns 50 hours per week.
Unlike 58 working weeks, 50 hours per week is at least possible. However, it may not be sustainable, especially when you include admin, quoting, marketing, client communication and everything else involved in running a service-based business.
This is where the calculator becomes more than a maths exercise. It helps you assess whether the result is practical.
Scenario 4: What Income Is Actually Realistic?
The most useful question may be this:
If the hourly rate is capped at $75, and the working weeks, weekly hours and billable percentage stay at realistic levels, what income is actually achievable?
In Goal Seek:
1. Set the required hourly rate cell to 75.
2. Set the changing cell to the target net annual income cell.
In this example, Excel returns a realistic target net income of approximately $49,960.
This means that if the hourly rate is capped at $75 and the other assumptions remain unchanged, the original $65,000 income target is not supported by the model.
That is valuable information because it shows the gap between the goal and the current constraints.
What to Do If the Numbers Do Not Work
If the calculator shows that your income target is not realistic under your current assumptions, you have several options.
You could:
- Increase your hourly rate
- Increase your billable percentage
- Work more hours
- Work more weeks, within realistic limits
- Reduce business expenses
- Lower the income target
- Change your service offer
- Move from hourly billing to packaged services
- Improve efficiency so more time can be billed
- Offer higher-value services that support a higher rate
The point is to understand which inputs can realistically change and which ones have practical limits.
Key Takeaways
Your hourly rate should be based on more than a guess.
A good pricing model should include your income goal, expenses, tax and retirement reserve, working weeks, weekly hours and billable time.
The required hourly rate is calculated by dividing total required revenue by annual billable hours.
A What-If Analysis Data Table lets you compare different combinations of weekly hours and billable percentages.
Goal Seek lets you work backwards from a target result, such as a maximum hourly rate or desired income.
If the model produces an unrealistic result, that does not mean the model has failed. It means the model has shown you which assumptions need to change.


Hi Mynda, great fan of your tutorials and the work you do to help others with Excel. Just wanted to point out a typo in your Excel Pricing Calculator template, on the Service Pricing Claculator tab you have said that the two inputcells for the ‘What If’ table are D13 and D2 but it should be D13 and D12.
Thanks for catching this, Stuart. I thought I’d fixed that, but looks like the page was cached, so the old file was still available. All fixed now.