Ordinarily when you want to create a table in Power Query, Power Pivot or PBI, you'd write a query to load it from an external source.
But any time you have data that won't change (or changes rarely), you can use a static table. That is, a table that doesn't need a data source, it is created directly inside Power Query or the Data Model.
Watch the Video

Download Sample Files
Enter your email address below to download the sample file.
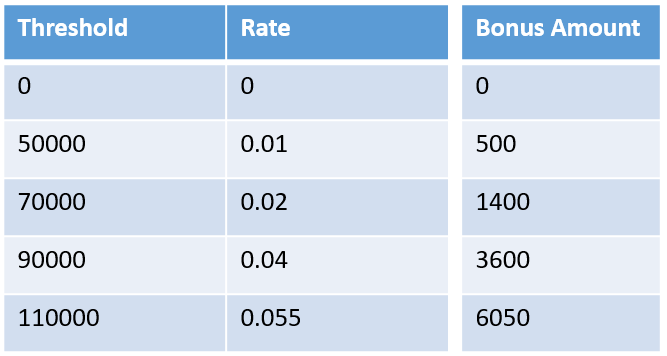
For example, You might have a table which can be used to calculate bonus amounts when certain sales thresholds are met.
This Threshold column is the $ value of sales you need to reach in order to get a bonus which is calculated by multiplying that threshold value by the rate.
Such data is only used for reference or calculations so there's really no need to load it from an external source.
In this post I'm going to show you 5 ways to create tables in Power Query, Power Pivot and Power BI without loading any data.
#table in Power Query
There are a number of ways to create a table in Power Query using functions like Table.FromList, Table.FromColumns, etc. but the way I find most flexible and use most often is the #table function.
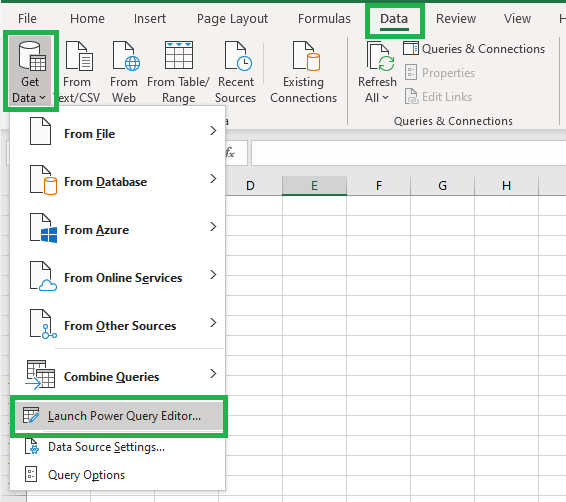
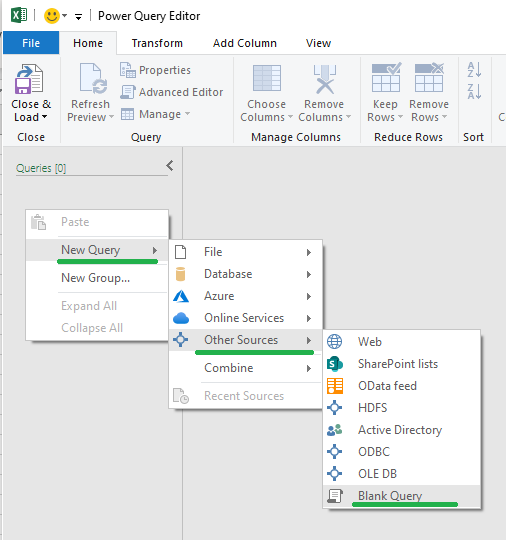
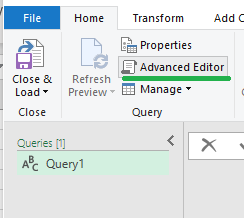
In Excel open the Power Query editor and start a new blank query. Then open the Advanced Editor.
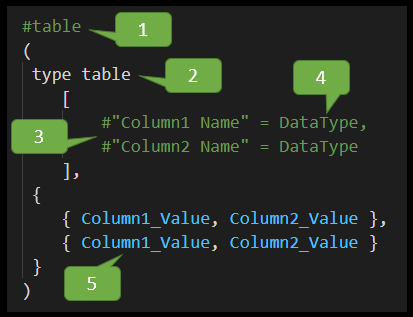
The syntax to create a table with #table is this
1 Start with the #table function name
2 Then declare that we're creating a type table
3 The column names
4 The data types of the columns
5 The data for the columns
If you want more columns then declare more in Section 3. To add more rows just add more lines in Section 5.
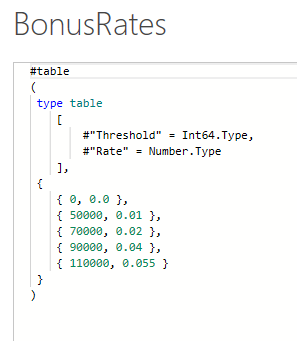
Filling in the data needed to create the Bonus Rates table
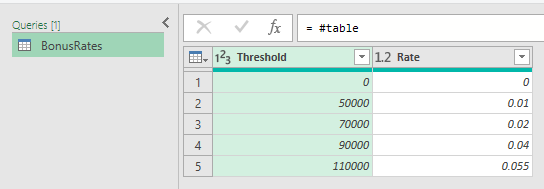
Gives me this table
If at some point I do need to change a value in the table, just open the query and make the change.
Power Pivot
With Power Pivot it's as easy as pasting in the data.
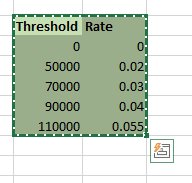
First, copy the data from the sheet
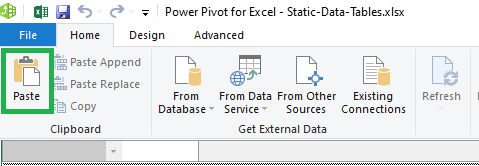
Then open Power Pivot
Because I've already copied data the Paste button is available
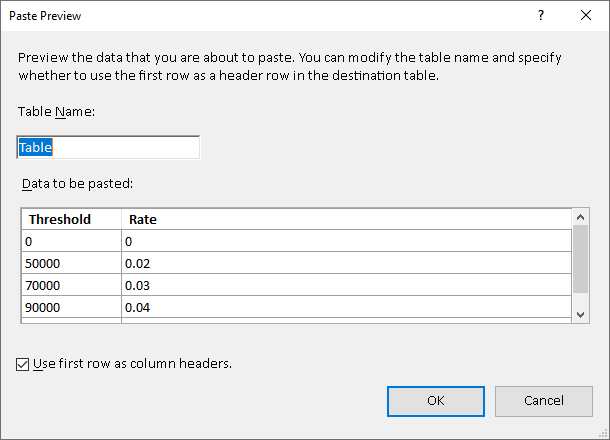
so clicking that brings up this dialog window
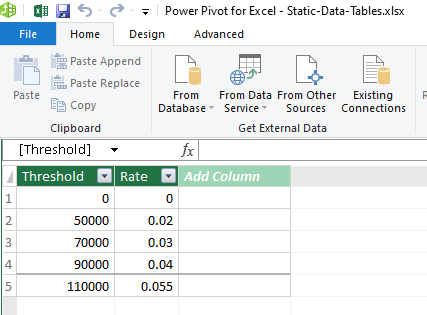
Give the table a name and leave the Use first row as column headers checked. Then click OK and the data is entered into a new table.
You can't make any changes to this table so if you need to alter it, you'll have to delete it and start over.
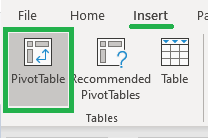
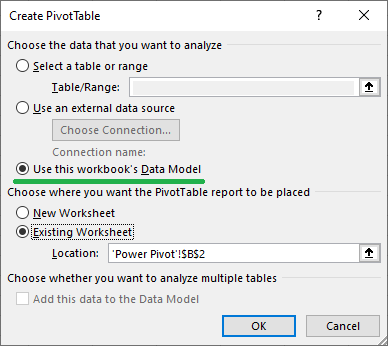
Close Power Pivot and back in Excel if I insert a pivot table
and select 'Use this workbooks data model'
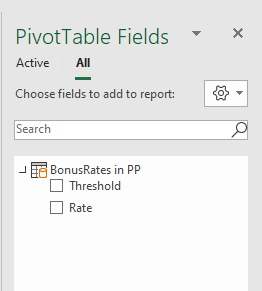
In the Pivot Table Fields you can see that the table is there ready to be used.
Power BI - Enter Data
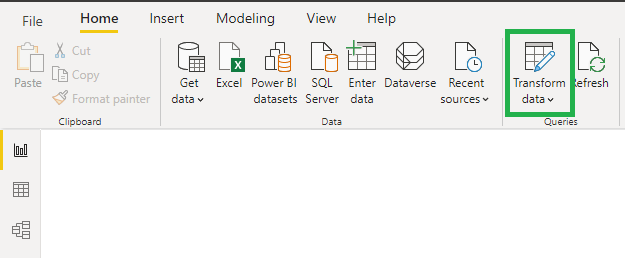
In Power BI Desktop there's a button on the Home tab of the Ribbon called Enter data.
Clicking on this brings up this dialog where you can type in data.
You can move around the table using the arrow (cursor) keys on your keyboard, or cick into cells with you mouse.
You can give your columns names, moving the cursor to the right adds columns, and moving it down adds rows.
If you make a mistake you can delete the columns and rows.
The easiest way to enter data is to copy/paste. Copy the data from its source, then click on the top left of the table and paste.
Give the table a Name and then click the Load button.
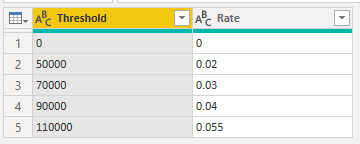
Once the table is loaded into PBI Desktop, you are left looking at an empty report screen. To check your table,click on the Transform data button to open the Power Query editor
The table is there as entered but you can see the data type of the columns is Any so they have to be changed.
If I open the Advanced Editor you'll see that the table is Stored as an Encoded, Compressed JSON Document and can't be edited.
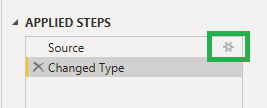
If you need to alter this table, click on the gear icon beside the Source step of the query, and it will open the Enter data dialog box again where you can make changes.
DAX Table Constructor
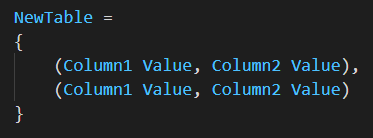
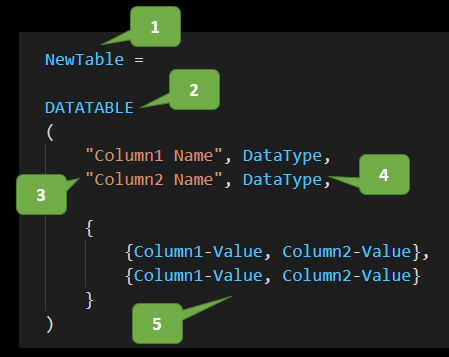
The table constructor syntax is very simple
You start with the table name NewTable in this example image. The table contents is surrounded by curly braces {} where each line is a row in the table.
Each row of data is surrounded by parentheses/brackets and rows are separated by a comma.
The number of columns is determined by the number of values in each row.
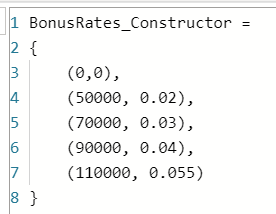
To create the BonusRates table I use this
There isn't any way to name the columns when constructing the table in this way.
By default if there is only 1 column the column name is Value. If there is more than 1 column they are called Value1, Value2 etc
You can change the column names after the table is created by double clicking the column name and typing in the new name
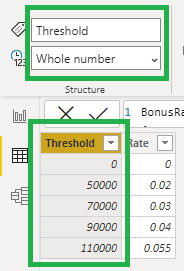
The data type of the column is determined by the data you enter
You can see here that Threshold is whole number, and Rate will be decimal
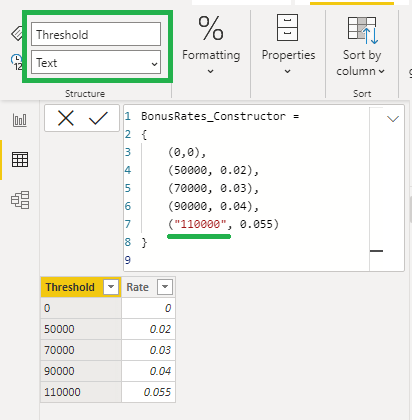
If you have a column of mixed data types, the entire column is converted to a common data type.
If I change one of the values in the Threshold column to text, the entire column is now text.
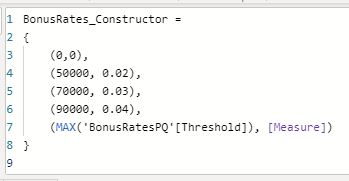
One useful feature of the table constructor is that the values in the table can be the result of any DAX expression that returns a scalar value.
You can refer to measures, or columns in other tables and use those to construct the table.
DATATABLE Function in DAX
The syntax for DATATABLE is similar to #table in Power Query
1 Give the new table a name
2 Call the DATATABLE function
3 The column names
4 The data types of the columns
5 The data for the columns
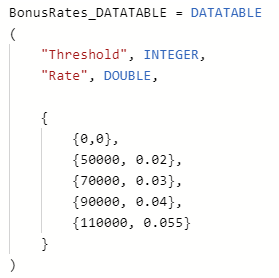
To use this, on the PBI Desktop Ribbon click on New table (on the Modelling tab) and enter the data
The columns are already named and the columns have a data type, so that saves us a few steps compared to using the table constructor.
Conclusion
Static tables can be handy when you don't want to load data that never (or rarely) changes.
I've shown you 5 different ways to create static tables in Power Query and DAX. I hope these approaches are useful to you.







Great read, thanks. I just happened to need it today!
One thing that made me struggle though: #”Column Name” = Text.Type is the correct syntax for text and not the usual “type text” as found elsewhere in M.
Yes Thierry, I used similar syntax in my examples for Int and Number (decimal).
Regards
Phil
These are great tips! We frequently encounter such static or semi-static situations. My bias generally would be to embed the values in a table using 1 of these techniques. A key decision, of course, is whether or not those situations exist across multiple applications where it would be better to have a common look-up/reference than to embed the data in multiple applications/workbooks. But, let’s hear it for having the option! Thanks for the tips!
No worries Jim, glad it was helpful.