In a previous post I looked at creating running totals in Power Query, here I'll be creating grouped running totals.
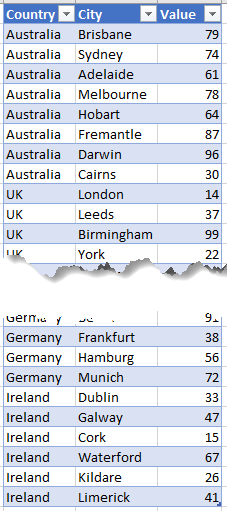
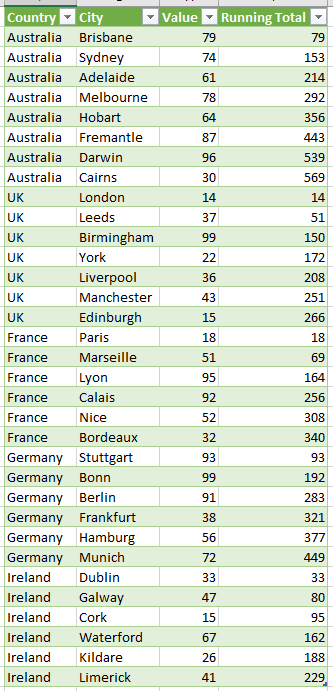
I'll start with a table of data showing values for cities within different countries.
Download the Workbook With Sample Query
The queries in this Excel file can be copied/pasted into the Power BI Desktop Advanced Editor and will work there too.
Enter your email address below to download the workbook with the data and code from this post.
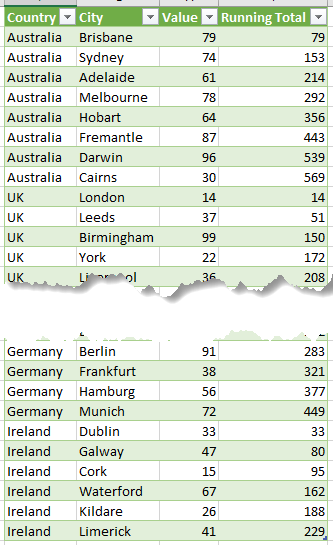
I want to create a running total for each country so that we end up with this where the running total resets when we reach a new country in our list.
Grouped Running Total Custom Function
The M code to create the custom function is very similar to the code for the running totals custom function.
Read More : Power Query Custom Functions
You don't need to worry about getting your hands dirty with M, you can just call the function as you would any other function in Power Query.
The function is named fxGroupedRunningTotal and takes two parameters named values and grouping, both of these are lists of equal length. The function returns a list which will have the same number of items as the input lists.
In this case the values parameter will be the list of values from our source table, and grouping will be the list of countries.
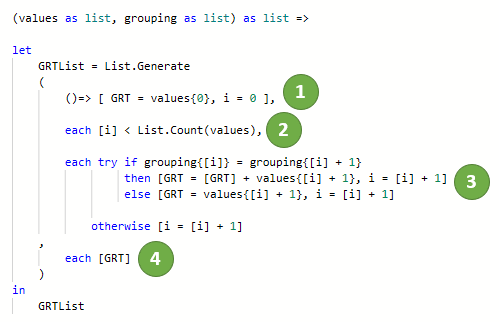
Here's how the function works. It uses List.Generate to work through each item in the grouping list, following the rules as described below. It uses two variables GRT which holds the running total, and i which is a counter
Each time a new value is created in GRT, it is added to the list that is the result of the function, GRTList
- Set the initial values. GRT takes the first value in the values list. The counter i is 0.
- Keep looping while i is less than the number of items in the values list. Remember: lists are indexed from 0.
- On each loop : if the current country in the list specified by grouping{[i]} is the same as the next country grouping{[i] +1} then add values{[i] + 1} to GRT else the next grouping (country) is different, so GRT just becomes values{[i] + 1}
- Add the value in GRT to GRTList
The try .. otherwise in step 3 is to catch the error generated when [i] + 1 exceeds the number of items in the input lists.
Using the Custom Function in a Query
After loading the source table, the query creates two buffered lists for the values and countries. Buffering the lists allows the query to run much faster as the lists are held in memory and not re-evaluated every time the query needs to refer to an item in the lists.
If you want to group by something else in your data, then change Source[Country] to whatever column you want to use.
Then it's just a case of calling the function to create the grouped running total, creating a table from the columns in the source table and the output from the function.
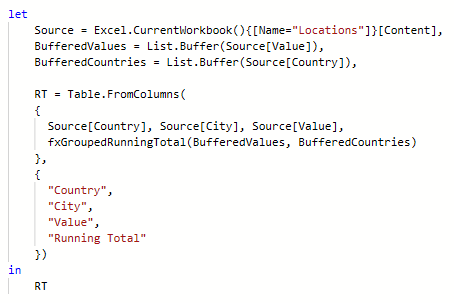
The final table loaded into Excel looks like this
How Fast Is This?
As with the running total query, by using buffered lists the query runs in a flash. Even when it's calculating for 100,000 rows, the query finishes in a couple of seconds.
In the example workbook you can download, I've created a table with 100,000 rows of data and a separate query to calculate the grouped running total for that. Try it out for yourself.
Pro Tip - Quickly Create 100,000 Rows of Data
If you need to enter a lot of data, like the 100,000 rows of dummy data for this post, you can do this using the Immediate Window in the VBA editor.
Press ALT+F11 to open the VBA editor. If the Immediate Window is not already visible, press CTRL+G to open it.
Valid VBA commands typed into the Immediate Window get executed after you press the Return/Enter key.
So I can put the value 101 into cells A1 to A10 on the active sheet with
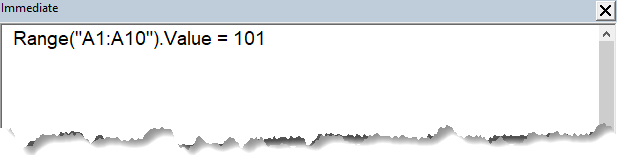
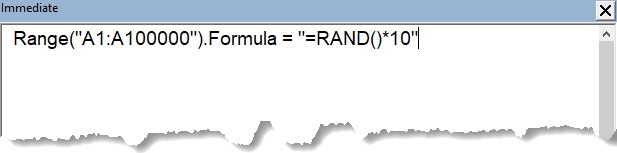
and to fill 100,000 cells with random numbers

Great tutorial. Thank you for sharing this information. Question on enhancing the function:
In the current version, the summation restarts as the country changes. How could I roundup the running total on the last instance of the country before starting the running total over on the next country?
Thanks Roman.
To round up the last value for each country use this code in the function
/*
    Written by Philip Treacy
    https://www.myonlinetraininghub.com/grouped-running-totals-in-power-query
*/

(values as list, grouping as list) as list =>

let
    GRTList = List.Generate
    (
        ()=> [ GRT = values{0}, i = 0, j = 0 ],

        each [i] < List.Count(values),

        each try
                 if grouping{[i]} = grouping{[i] + 1}
                 then [GRT = [GRT] + values{[i] + 1}, i = [i] + 1, j = [j] + 1]
                 else [GRT = values{[i] + 1}, i = [i] + 1, j = 0]

             otherwise [i = [i] + 1, j = [j] + 1]
    ,
        each let _group = grouping{[i]} in if List.Count(List.Select(grouping, each _ = _group)) - 1 = [j] then Number.RoundUp([GRT]) else [GRT]
    )
in
    GRTList
Regards
Phil
Hi Philip –
I have had success getting this grouped running total to work for a single running total column. I am hoping it’s possible to perform this to get a second running total column as I’m ultimately looking to compare the values in one running total to the values in the other running total. I have considered duplicating the query to have it perform the second column and then merge the two together, but if there’s a more efficient way that you’re aware of, I appreciate the insight.
Hi Lindsay,
You can call the function again to create another running total column.
If you want us to have a look at this for you, please start a topic on our forum and attach your data in a file.
Regards
Phil
Hi Phil,
I have a data set that has a status field with a status of “closed” and (4) other statuses that are essentially open. I am trying to create a running total of open records. I’ve tried a number of ways, but I am having issues. Any suggestions would be appreciated.
Thanks,
Rich
Hi Rich,
Can you please create a new topic on our forum and upload a sample file there so we can test it?
Will be much easier to help.
Thank you
Catalin
Hi!
This post helped me a lot.
Thank you! 🙂
Great to hear, Alejandro!
OMG, thank you for this! You helped me figure out a dilemma that had been plaguing me for months!
I work in higher education, so I deal with terms and term week numbers. I created a reporting dashboard in Power BI for a program I coordinate. Part of that is tracking when we receive an alert for a student based on the week of the term. I had been calculating term week numbers based on the duration of [Date] – [Start Date] for that term. The issue is, that doesn’t account for college holidays, so a 15-week term could end up showing 16-17, even 18 weeks, depending on how many holidays there are during that term. That also makes term-by-term week numbers inconsistent when you want to compare apples to apples since some terms have longer breaks than others.
I had the idea to adjust the Term Week by incorporating some sort of running total as an offset to either the row date or week number. Using a grouped running total by term and date was the missing puzzle piece, and one I would not have come up on my own using M language! I used the term-specific running total column by subtracting it from Number.From([Date]), changing it back to date format, then using Duration.Days([Adj Term Week] – [Start Date]) / 7 + 1. Finally, I rounded the week number down and replaced the old Term Week column with the new Adj Term Week and OMG IT WORKS!
It finally works. Ugh, thank you.
No worries Kat, glad it was able to help you figure out your issue.
Regards
Phil
Hi,
Thanks – this does work but takes a very long time to run. I have a small dataset of 177 rows of 6 columns. I have added a concatenated column to give an identifier by Account and Category which I’ve sorted on.
My file size is 70Mb as it collects a lot of historical data, but the the processing of these is done previously in other queries and then referenced. The previous steps of the query to for example create the concatenated column are instant.
The Buffering steps take 3 minutes and the RT step takes 10 minutes with processor at 50% and memory at 3Gb so I’m not seeing the performance shown in your examples
Do you know what might be going on please?
Hi David,
Not sure, are you able to start a topic on the forum and provide the file ?
Regards
Phil
Great function!
I want to use this with cumulative totals of sales of product A and B per quarter. But in some quarters we don’t have sales for product B and the function returns a cumulative total of 0. How can I fix this?
Hi Jasper,
hard to say without seeing your data. Please start a topic on our forum and attach you file so i can take a look.
Regards
Phil
Hello Phil, this is an excellent tutorial!
Would it be possible to extend the function to allow me to group on more than one column?
Say we have: [Town, Store, Item, Price] as my columns and I want to group on [Town, Store] instead of just Town or Store when performing a grouped running total on Price.
As of this writing the function allows for one column only to be specified as the grouping column.
I’m thinking there has to be a way to extend it to allow additional columns to be grouped; any suggestions on this?
Thanks!
Thanks Eric.
Could you achieve this by first sorting your table by Town and then Store, and then calculate the running total using the Store column?
If that doesn’t work for you I may need to see your data and an example of exactly what you are after. You could start a topic on our forum and attach a file with sample data for me to look at.
Regards
Phil
Thanks Phil,
Concievably this should work as all of the stores would be ordered by town before applying your grouped running total. Since the logic detects differences in the grouping the counter in the code should reset before moving on to the next town. An edge-case would be if one of the towns had a store at the end of its list with the next town having the same store at beginning.
A fictitious scenario to illustrate:
Town Store Item Sales Running Total Comments
Athabasca McLeods fishing pole 50 50
Athabasca McLeods tackle box 40 90
Athabasca Zellers bowl 3 3 3
Athabasca Zellers cup 2 2 5
Melville Petco cat food 5.5 5.5
Melville Petco fish food 7 12.5
Yorkton Petco cat food 6 18.5 Running total continues to count despite stores being in different towns.
Yorkton Petco dog food 5 23.5 Running total continues to count despite stores being in different towns.
Yorkton Zellers plate 2 2 2
Yorkton Zellers spoon 1 1 3
Since Petco is in both Melville and Yorkton the logic does not detect that this store is in different towns.
Is there a better way to code the function to prevent this behaviour?
Thanks again for your help on this!
Eric
Hi Eric,
You can supply the Town and Store columns as a single composite (key) column to the function, using List.Zip
fxGroupedRunningTotal(Data[Sales], List.Zip({ Data[Town], Data[Store] } ))
Regards
Phil
Hello,
I am having problems trying to implement the function in my dataflow in power bi service; Since I have to apply it to several columns, I have generated the lists of each column in power query and finally, I have called the function for each of them in a single function, something like this;
.
.
.
listCategory_1 = List.Buffer(Source[Category_1]),
listValues_2 = List.Buffer(Source[Values_2]),
listValues_3 = List.Buffer(Source[Values_3]),
…
listValues_n= List.Buffer(Source[Values_n]),
RT = Table.FromColumns(
{
Source[Category_1], Source[Values_2], Source[Values_3]…Source[Values_n],
fxsum(listValues_2, listCategory_1), fxsum(listValues_3, listCategory_1)…fxsum(listValues_n, listCategory_1)
},
{
“Category_1”, “Values_2”, “Values_3″, …”Values_n”, “SumValues_2”, “SumValues_3″, …”SumValues_n”
}
)
in
RT
Everything seems fine in the first calculated rows, even the data flow can be saved but when updating completely I get the following error:
Error: The field ‘1’ of the record wasn’t found. Request ID etc…
It might be necessary to add a step in the function that returns the value of i=1 at the end..??
Hi Gab,
Really hard to debug without seeing the data. have you made any change to the function?
What record/data is being referred to in the error?
Can you try narrowing down the cause of the problem by passing 1 list of values into the function at a time?
Regards
Phil
Hi,
Thanks for excellent article:
Any thoughts on below:
(1) Would it be better to apply List.Buffer inside the function rather than calling code – that way function is more self contained and if used in multiple scenarios you wont need to remember to buffer each time in the calling code.
(2) Rather than rely on the try / otherwise error check logic would it be cleaner to check that the counter doesnt exceed range with an if statement?
Thanks
– Charl
Thanks Charl.
1. Yes you could do it that way.
2. You could try writing that but it might end up being a bit more complicated/require more lines of code. I’m using try .. otherwise because at some point grouping{[i] + 1 will exceed the number of elements in the list and generate an error. It also tests if the grouping changes, so it’s acting as 2 tests in 1. You’d need to accommodate both of these tests in your if.
Regards
Phil
Based on the set up it only works when the source list is sorted by the grouping value. Would it not also work if the GRT counter is GRT&”-“&grouping{i} and than delete the “GRT = values{[i] + 1},” in the else loop?
It does not work at the moment in my case but you might have a solution to set all GRT&”-“&grouping{i} variables to 0.
I would rather not sort for the grouping since I need the original sorting for other steps.
Thank you!!
Hi Chris,
Sorry I’m not following what changes you are proposing to make to the code. Have you tried what you suggest and gotten it working?
The idea of a grouped running total is that the total is carried on for each subsequent value in the grouping. If you don’t sort the values by the grouping, how do you calculate your RT and make it readable?
Could you do the sorting, calculate the RT, then unsort? You could use an index column to to this.
Regards
Phil
Absolutely Brilliant! Thank you!
Glad it was helpful, Brian!
Hello,
could you please advise what to do with 0 values in my value column. I can’t remove them, because i make the grouping by month and it is important to know that in this month the value was 0. But I receive the error that 0 values are not allowed for the List. Should I use another Type of Object for values?
(Expression.Error: The value “0” cannot be converted to the type “List”.
Details:
Value=0
Type=[Type])
Thanks, Daria
Hi Daria,
My code can cope with 0, or any numeric value, in the values column. So I’m not sure why you’re getting that error.
Can you please start a topic on our forum and attach your file so I can take a look.
Regards
Phil
Hi Phil, thank you for your reply. I found the error and it’s working with 0 too.
Regards
Daria
Great, glad you got it fixed.
Hello!
I have the same error: can you give some hints about how to solve? is there a topic in the forum that can be linked here?
Thanks a lot!!
Hi,
I don’t know what was wrong with Daria’s code as he said her fixed it. So to help with your s I’d need to se your code. Please start a topic on the forum and attach your file.
Regards
Phil
I have a question about the M code:
how does the “i” between square brackets – “[i]” differ from “i” without square brackets?
Hi Tomek,
[i] is the current value of the variable i.
i is the new value that you are creating in this current loop.
So if [i] is 1 then i = [i] + 1 means create a new value for i that 1 + 1.
Regards
Phil
I follow both the running totals tutorial and the grouped running totals tutorial and have greatly improved the speed of the loading tables. Thank you so much. Great tutorial.
Thanks for feedback, glad to hear it works for you.
Just a comment on the Pro Tip – you can do the same thing without VBA, just select the range you want (my personal way would be to type A100000 in the name box to go to that cell then Ctrl+Shift+UpArrow), then type the formula =RAND()*10, then press Ctrl+Enter to fill all the cells with that formula.
Personally I’d also use =RANDBETWEEN(1,10) which gives random integers only, but it depends on what you want your fake data to be.
Thanks for the tip David.
I think I love you
Thanks 🙂
awesome! please ,how to make it to calculate running percentage to total?
Hi Martin,
You should do this in a PivotTable using the Show Value As tools.
Mynda
This content is extremely helpful so please don’t take this the wrong way. I was working through this article and trying to understand the logic of the custom function. In this section, item 2, it says “Keep looping until i is less than the number of items in the values list.” Should it say “Keep looping while i is less…”.
Yes it should, thanks for picking that up Peter, I’ve corrected it now.
Regards
Phil
How do we calculate running debit and credit balances with power query according to customer name
If this tutorial doesn’t explain the process according to your needs, please post your question on our Excel forum where you can also upload a sample file and we can help you further.
Far out, this is brilliant, works very well indeed on my 26,000 row dataset.
It’s amazing how powerful List.Generate is!
Many thanks Mynda 🙂
Glad it was helpful, Jonno!
Thank you so much for the example , very useful and very well explain.
Thanks Benoit, glad to help.
Great to hear, Benoit!
Hi,
I need exact above article except that I need the running total (in groups) sums the last 25 days.
(Running the last 25 days Total, in Groups).
Would you please help me for that?
Thanks
Hi Keivan,
Please post your question on our Excel forum where you can also upload a sample file and we can help you further.
Mynda
hi Mynda
Do you do one one training through zoom by any chance? I need training just on vlookup for my work and for years nobody has been able to explain it to me. [email protected]. thank you very much . I’m in the US
Hi Bita,
I don’t do one on one training, but I recorded a video on VLOOKUP just a couple of weeks ago and a few people have told me that until watching my video they’d never been able to get their head around it. Please try watching the video and if you’re still stuck, please post your question on our Excel forum where you can also upload a sample file and we can help you further.
Mynda