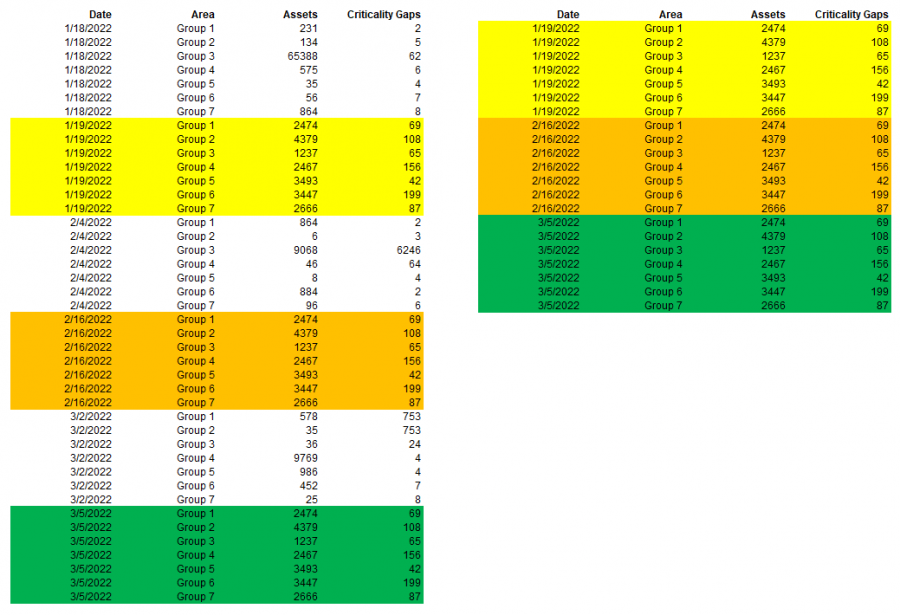
Hello, I'm trying to group the Date column in Power Query on the latest date for each month, as displayed in the image below. I'm not sure how to do this, as the Group By function doesn't seem to allow for date calculations. Any help would be greatly appreciated!

One way is to create a new column that is the same day for each month (eg first of the month) then group on that to get the max date for each month, then merge that back to the original table to only get the data for the max date of each month - for example:
let
Source = Excel.CurrentWorkbook(){[Name="Table1"]}[Content],
ChangedTypes = Table.TransformColumnTypes(Source,{{"Date", type date}, {"Area", type text}, {"Assets", Int64.Type}, {"Criticality Gaps", Int64.Type}}),
AddMonthGroup = Table.AddColumn(ChangedTypes, "MonthGroup", each Date.StartOfMonth([Date])),
GroupMaxDates = Table.RemoveColumns(Table.Group(AddMonthGroup, {"MonthGroup"}, {{"MaxMonthDate", each List.Max([Date]), type datetime}}),{"MonthGroup"}),
FilterMaxMonth = Table.RemoveColumns(Table.NestedJoin(ChangedTypes,{"Date"},GroupMaxDates,{"MaxMonthDate"},"Table1",JoinKind.Inner),{"Table1"})
in
FilterMaxMonth
Another way (may be longer with some tricks)
first insert the Month name for each date, then group by Month name, max of Date and the entire table, then expand the table, check with [Max_Date] = Date, then filter all the True, that it
let
Source = Excel.CurrentWorkbook(){[Name="Table1"]}[Content],
ChangedTypes = Table.TransformColumnTypes(Source,{{"Date", type date}, {"Area", type text}, {"Assets", Int64.Type}, {"Criticality Gaps", Int64.Type}}),
#"Inserted Month Name" = Table.AddColumn(ChangedTypes, "Month Name", each Date.MonthName([Date]), type text),
#"Grouped Rows" = Table.Group(#"Inserted Month Name", {"Month Name"}, {{"Max_Date", each List.Max([Date]), type date}, {"Data", each _, type table}}),
#"Expanded Data" = Table.ExpandTableColumn(#"Grouped Rows", "Data", {"Date", "Area", "Assets", "Criticality Gaps"}, {"Date", "Area", "Assets", "Criticality Gaps"}),
#"Added Custom" = Table.AddColumn(#"Expanded Data", "Custom", each [Max_Date]=[Date]),
#"Filtered Rows" = Table.SelectRows(#"Added Custom", each ([Custom] = true)),
#"Removed Columns" = Table.RemoveColumns(#"Filtered Rows",{"Custom", "Month Name", "Max_Date"}),
#"Changed Type" = Table.TransformColumnTypes(#"Removed Columns",{{"Date", type date}})
in
#"Changed Type"
As a variant:
let
Source = Excel.CurrentWorkbook(){[Name="myData"]}[Content],
Headers = Table.PromoteHeaders(Source, [PromoteAllScalars=true]),
Types = Table.TransformColumnTypes
(
Headers,
{
{"Date", type date},
{"Area", type text},
{"Assets", Int64.Type},
{"Criticality Gaps", Int64.Type}
}
),
StartOfMonth = Table.AddColumn(Types, "Start of Month", each Date.StartOfMonth([Date]), type date),
Sort = Table.Sort(StartOfMonth,{{"Area", Order.Ascending}, {"Date", Order.Descending}}),
Group = Table.Group
(
Sort, {"Area", "Start of Month"},
{
{"Group", each _, type table
[
Date=nullable date,
Area=nullable text,
Assets=nullable number,
Criticality Gaps=nullable number,
Start of Month=date
]
}
}
),
RemoveColumns = Table.SelectColumns(Group,{"Group"}),
AddCustom = Table.AddColumn(RemoveColumns, "Custom", each Table.FirstN ( [Group] , 1 )),
RemoveColumns1 = Table.SelectColumns(AddCustom,{"Custom"}),
Expand = Table.ExpandTableColumn
(
RemoveColumns1, "Custom",
{
"Date", "Area", "Assets", "Criticality Gaps"
},
{
"Date", "Area", "Assets", "Criticality Gaps"
}
),
Sort1 = Table.Sort
(
Expand,
{
{"Date", Order.Ascending},
{"Area", Order.Ascending}
}
)
in
Sort1
Another means is to create a column that is the month number. Then Group By the Month for a Max Date
Duplicate that query and remove the last step
Join the two tables on the max date
AS you can see, there are many options available to solve this
Thank you all for your replies. These are all really helpful, and very much appreciated!
