Hi Again,
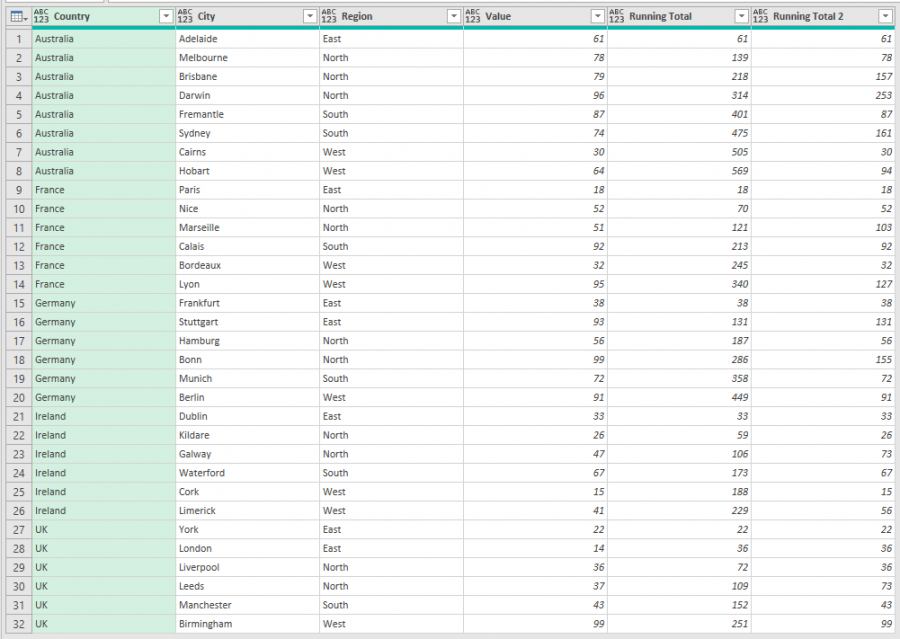
So following on from the grouped running total column thread and using Phils code (very tidy solution) I can get a running total around 1 column but what if you have a couple of columns to contend with - Is this possible?
using the function already described by Phil / Mynda - fxGroupedRunningTotal
I've tried altering the query code but I'm getting an error saying RT only allows 2 parameters which you can see in the 1st line of the function code
(altered query code)
BufferedValues = List.Buffer(Source[Amount]),
BufferedRegion = List.Buffer(Source[Region]),
BufferedCountries = List.Buffer(Source[Source]),
RT = Table.FromColumns(
{
Source[Source], Source[Region],Source[Period], Source[Amount],
fxGroupedRunningTotal(BufferedValues, BufferedCountries,BufferedRegion)
},
{
"Source",
"Region",
"Period",
"Amount",
"Running Total"
})
in
RT
So i'm guessing the function requires a bit of tweaking around the 'each try ' area and its a little bit beyond me TBH but has anyone done that on Phils code for the function ?
(values as list, grouping as list) as list =>
let
GRTList = List.Generate
(
()=> [ GRT = values{0}, i = 0 ],
each < List.Count(values),
each try
if grouping{} = grouping{ + 1}
then [GRT = [GRT] + values{ + 1}, i = + 1]
else [GRT = values{ + 1}, i = + 1]
otherwise [i = + 1]
,
each [GRT]
)
in
GRTList
Desired Output
| Source | Region | Period | Amount | Running total |
| Australia | North | Brisbane | 79 | 79 |
| Australia | North | Sydney | 74 | 153 |
| Australia | South | Adelaide | 61 | 61 |
| Australia | South | Melbourne | 78 | 139 |
| Australia | South | Hobart | 64 | 203 |
| Australia | South | Fremantle | 87 | 290 |
| Australia | South | Darwin | 96 | 386 |
| Australia | South | Cairns | 30 | 416 |
| UK | North | London | 14 | 14 |
| UK | North | Leeds | 37 | 51 |
once again - thank you - been on a steep learning curve this week
Hi Lee,
To achieve this you call the RT function again and pass in the Value and Region columns. Just make sure you sort the table by Country first and then by Region.
Here's the code, check the file for the full thing
BufferedRegion = List.Buffer(RT[Region]),
RT2 = Table.FromColumns(
{
#"Sorted Rows"[Country], #"Sorted Rows"[City], #"Sorted Rows"[Value], #"Sorted Rows"[Region], RT[Running Total],
fxGroupedRunningTotal(BufferedValues, BufferedRegion)
},
{
"Country",
"City",
"Value",
"Region",
"Running Total",
"Running Total 2"
}),
Regards
Phil

incredibly helpful, Thank you Phil
No worries.
