This question was first asked in the Microsoft Technet forum, but didn't get any response. Therefore I post it now here.
Dear all,
being relatively new to the topic "power query" recently I'd received a set of files from an optical measurement tool (each xlsx-files). My task was to get the measurement data out of the files into one single table and create a diagram for comparison with other measurements and some other evaluations.
Each measurement-file has in it's first lines some meta data regarding the measurement tool, etc. and after that contains the measurement data in two columns, the first with wavelengths (in nm) from 900 or 1000 down to 350 with a decrement by -1, the second with corresponding intensity-values. Name of the files are the sample-IDs of the measured glasses.
How to transform data from various files into one file is what I already can achieve - into one long list with three columns: [file name] - [wavelength] - [intensity]. But how to transform this into a table with the sample-IDs (file-names) as column-headers and wavelengths as line headers, to create the x-y-diagram and further evaluation, I can only realize inside Excel, but no idea how to achieve via power query.
To illustrate my problem I created a set of files (in the zip-file 'Filecollection.zip') with similar structure, but designed content (to keep confidentiality-issues) and one to 'evaluate' them ('Evaluationfile.zip') like I want to do with the original files:
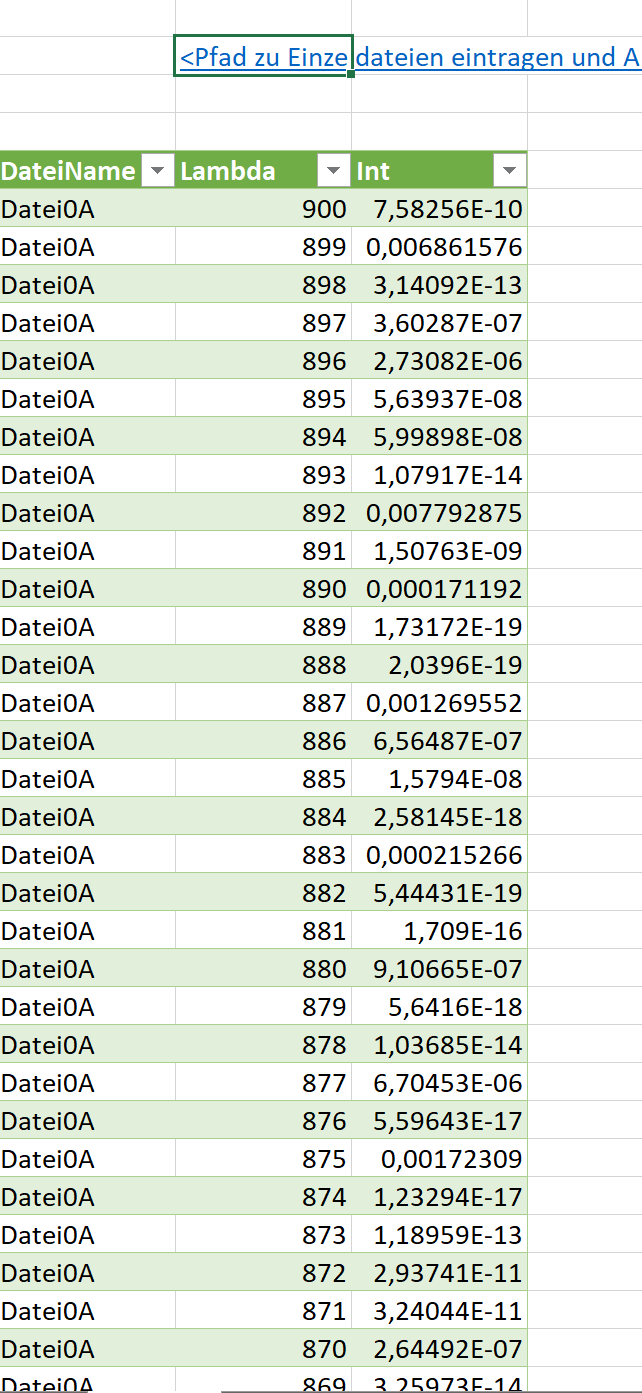
to get the 'long list':
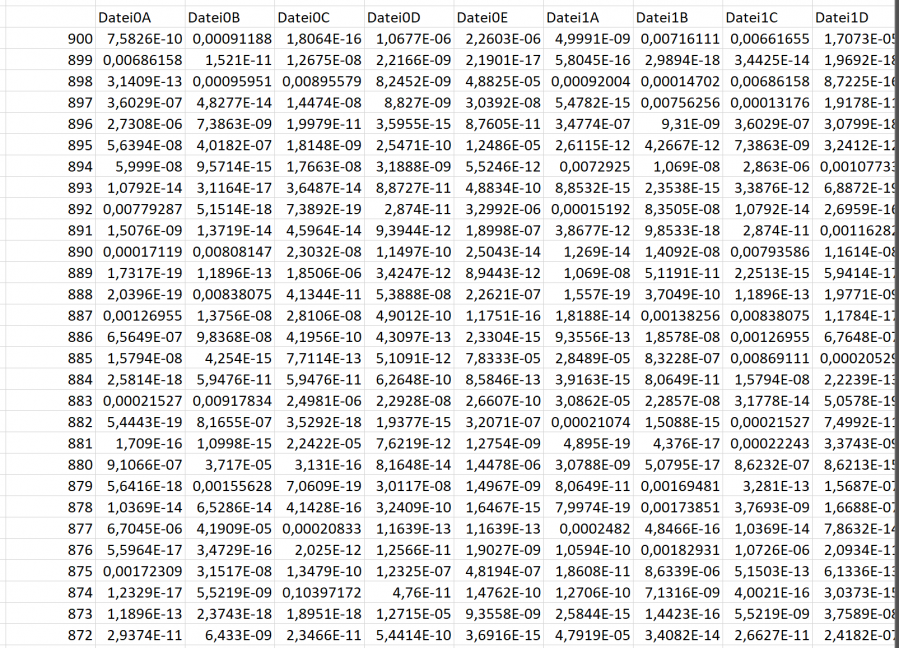
transform it into a table:
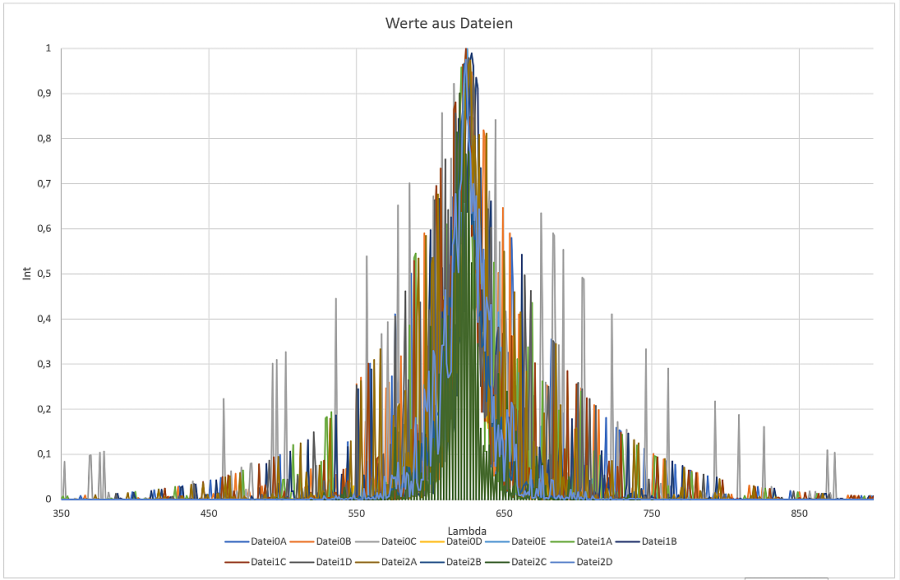
and create a diagram out of that
The sample files have the naming structure 'DateiGx.xlsx' with 'G' being the 'generation' of variation and 'x' a letter from A to D or E. Generation 0 is somehow orderly acc. to the original files, Generation 1 to 4 have some variation in the range of the wavelengths, number formatting (English/US or continental), increment of wavelengths, etc., just to cover possible issues with optical measurement that might occur and to learn how to deal with inside power query.
When you want to use the sample files, the 'filecollection.zip' should be unzipped to a folder and inside the 'evaluation.zip' file you should type the path to that folder into cell B2, currently carrying the text "", which can be seen in the first screenshot above. Afterwards the query should be able to work. The query up to now looks like
let
// first get or define some parameters like path to files ("Pfad"), constraints to wavelengts ("Lambda.Min", "Lambda.Max")
Mappe=Excel.CurrentWorkbook(),
Pfad=Mappe{[Name="PfadZuOrdner"]}[Content]{0}[Column1],
Lambda.Min=350,
Lambda.Max=900,
// get the files in the path
Quelle = Folder.Files(Pfad),
// make sure, only wanted files are evaluated (xlsx-files with the structure "Datei"", "Datei01.xlsx" was generator for the other files...)
DateiWahl = Table.SelectRows(Quelle, each ([Extension] = ".xlsx") and Text.StartsWith([Name],"Datei") and ([Name] <> "Datei01.xlsx")),
DateinamenBilden = Table.AddColumn(DateiWahl, "DateiName", each Text.BeforeDelimiter([Name], "."), type text),
// select relevant columns
RelevanteSpalten01 = Table.SelectColumns(DateinamenBilden,{"DateiName", "Content"}),
// go into the files to extract data
Dateiinhalte = Table.AddColumn(RelevanteSpalten01, "Inhalt", each Excel.Workbook([Content])),
DatenInTable = Table.ExpandTableColumn(Dateiinhalte, "Inhalt", {"Data"}, { "Data"}),
Inhaltsspalten = Table.ExpandTableColumn(DatenInTable, "Data", {"Column1", "Column2"}, {"Column1", "Column2"}),
// make sure, wavelengths are within constraints (between Lambda.Max and Lambda.Min)
NurNutzdaten = Table.RemoveColumns(
                           Table.SelectRows(Inhaltsspalten, each ([Column2] <> null) and (
                               if Text.Contains(Text.From([Column2]),".") then Number.From([Column1],"en-US") else Number.From([Column1]))<=Lambda.Max and (
                               if Text.Contains(Text.From([Column2]),".") then Number.From([Column1],"en-US") else Number.From([Column1]))>=Lambda.Min),
                        {"Content"}),
// finally make sure that culture-properties are taken care of and only desired content gets into the result list (filenames, wavelengths, intensities)
WertExtraktion = Table.RemoveColumns(
                              Table.AddColumn(
                                   Table.AddColumn(NurNutzdaten,"Lambda",
                                         each if Text.Contains(Text.From([Column1]),".") then Number.From([Column1], "en-US")
                                                                                                              else Number.From([Column1]),type number),
                                "Int", each if Text.Contains(Text.From([Column2]),".") then Number.From([Column2], "en-US")
                                                                                                              else Number.From([Column2]),type number)
                          ,{"Column1","Column2"})
in
WertExtraktion
If you have some ideas, how to realize the transfomation into a table using power query, please share with me.
Thanks for your support,
RaiSta
Hi,
Have you tried to pivot the "long" table?
Select the DateiName column, then from Transform tab press the button Pivot Column. In the dialog box, select the Int column from dropdown for the values.
This will create the horizontal version with dateiName values as headers.
Ok, thanks for your reply!
Two remarks:
1) in my 'evaluation-sheet' I'm working with the 'sumif'-function (hope that's the name of the function in english Excel... working in the German version...). So how to I pivot the DateiName-column? I can't find any 'transform'-tab in my Excel.
2) anyhow that means, it must be done _after_ the data has been loaded into the Excel-sheet. There is no way to get it done all inside the (power) query? ... because, when I've got it in the sheet and need to do further action, the pivot-version might be more convenient or faster, though till now I tried avoiding pivot tables - somehow didn't like them in the past, but how to work in an Excel-sheet, I know ways (sumif, array-formula, etc.).
But I'd like to get it done all within the query (data to table) to (1) avoid the long list in the excel sheet and (2) to have a 'one-button-solution'.
Any idea? Thanks!
You asked for a Power Query solution, so my answer was related to power query menu, not Excel.
Transform tab is in Power Query menu, not in Excel menu.
From Power Query window, Select the DateiName column,
Press the Pivot Column from Power Query menu - Transform tab,
In the dialog box select the Int from dropdown to indicate the values column.
The output of Power Query is a table, not a pivot table. Pivot Column refers to a transformation operation within power query, not to a Pivot table.
Ohhh Kaaaay! Sorry for missunderstanding your reply - my fault. As soon as I will be next to my pc (currently writing on my tablet...) I will see how I can put it into action with my query. Just got trapped by the "Pivot column" 'keyword'...
Thanks for your patience!
Rainer
