Good Morning, I have a table with multiple tickets, and these tickets have several columns with multiple values stored in them. I broke them, and created a multi-value bridge table that contains them, and the tickets are in a separate table which is the one side of the relationship. I spend a lot of time, removing duplicates, or going back to the source table to isolate what I am seeing for verification.
I found this blog
| https://stackoverflow.com/questions/42404400/have-column-with-multiple-values-in-powerbi-for-use-with-a-slicer/42406689?noredirect=1#comment71997813_42406689 |
And it worked for searching the multi-value field. BUT when I try to filter by other columns within the lookup table, it doesn't total right.
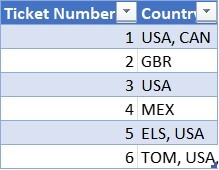
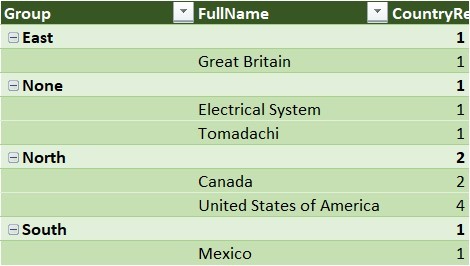
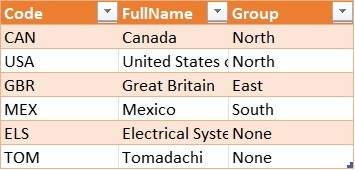
Blue is the fact table (Tickets), Orange is the lookup table (Country), Green is a Pivot table. I most often display the data by the groups, and it's not totaling right.


My current measure:
CountryResult = COUNTX (
FILTER (
Tickets,
[Country] = FIRSTNONBLANK(Country
, 0 )
|| FIND (FIRSTNONBLANK(Country, 0 ), [Country], 1, -1 ) > -1),
[Ticket Number]
)
Finally, the real reason I'm doing this, is that I am not getting a filtered list of details when moving from Tickets, across Multi-Value Bridge to the lookup tables. I tried: Chris Webb's BI Blog_ Making Power BI Drillthrough Return The “Right” Rows When You Use It With Complex Measures Chris Webb's BI Blog.html, and I remember it was said that it would in BI or PowerPivot, but I was not able to apply it to Excel 2016.
I have a learned a tremendous amount from your site, and videos, I know that I don't completely understand the structure of DAX.
Jonathan
Hi Jonathan,
Welcome to our forum!
This technique doesn't work in Excel, sorry.
Mynda
