Hello all,
To get to the point
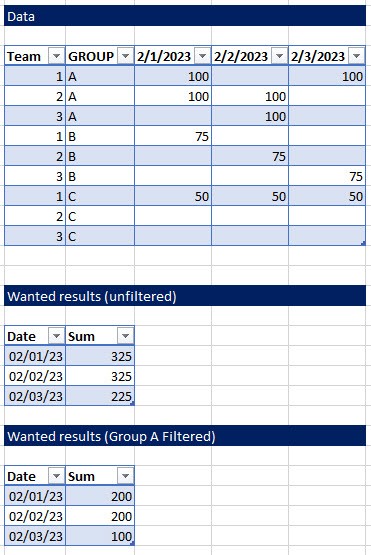
This is the data

I ultimately want to make a pivot chart with slicers so that I can create an interactive dashboard that can filter by group (and possibly date range).
I would also like the date to be dynamic as the range will increase in columns each day.
Thank you all so much in advance!
Hi Kenneth,
You can use Power Query to unpivot ( https://www.myonlinetraininghub.com/power-query-unpivot-scenarios) the first table, and then use PivotTables and Slicers ( https://www.myonlinetraininghub.com/excel-pivot-table-video-tutorial) to summarise and filter the data according the second and third tables in your screenshot.
If you get stuck, please provide the Excel file you used to create the screenshots and we can help you further.
Mynda
