Dear All,
As me try to create some DAX(Measure) in Power Pivot with condition as below but facing error, kindly help/guide how to create DAX in Pivot,
Let Say: DISTINCTCOUNT with condition(mean need only data with status "On" or "Off"
Here the mean point in my demo
1. DISTINCTCOUNT for the Shop only Status "On"
2. Total Sale for the Shop only status "On"
3. Total Avg Sales only status "On"
4. DISTINCTCOUNT for the Shop Total Sales >= Total Avg only Status "On"
Here link for demo file or attached below
https://drive.google.com/file/d/11iXjSMIusvP5kcZI7b-vZ3wA8uC4P1wj/view?usp=sharing
Hi Dalasamoud,
Try:
Total Shop:=CALCULATE(DISTINCTCOUNT(tbtesting[Shop ID]),tbtesting[Status]="On")
For SUM, use a similar measure (you already have that):
Total SalesON:=CALCULATE(SUM(tbtesting[Total_Sales]),tbtesting[Status]="On")
AVG:
Total AVGwith Status On:=CALCULATE(AVERAGE(tbtesting[Total_Sales]),tbtesting[Status]="On")
The average is 191.67, not 230 as in your expected results.
Dear Catalin Bombea,
Thank you (^_^) for your kindness, the Measure is working fine,
There's a concern how to find DISTINCTCOUNT for the Shop as below
1. How many Shop(DISTINCTCOUNT) Total Sales(Status="On") >= Total AVG(Status="On")
Let say: As my demo excel below
| Shop ID | Shop_Name | Total_Sales | Month | Status |
| 001 | Mr Daovone | $100.00 | Jan | On |
| 002 | Mr Keo | $150.00 | Jan | On |
| 003 | Mrs khunjai | $90.00 | Jan | On |
| 004 | Miss keotar | $300.00 | Jan | On |
| 005 | Mr Soudjai | $210.00 | Jan | On |
| 001 | Mr Daovone | $300.00 | Feb | On |
Total Sales: 1,150.00 $
Total AVG: 191.67 $
Shop(DISTINCTCOUNT) Total Sales(Status="On") >= Total AVG(Status="On") = 3 as below Shop Id
1. 001 Total Sales:400$
2. 004 Total Sales:300$
3. 005 Total Sales:210$
If you have those 3 measures, all you have to do is to use them:
DistinctON:=CALCULATE(DISTINCTCOUNT(tbtesting[Shop ID]),tbtesting[Status]="On")
TotalSalesON:=CALCULATE(SUM(tbtesting[Total_Sales]),tbtesting[Status]="On")
AvgON:=CALCULATE(AVERAGE(tbtesting[Total_Sales]),tbtesting[Status]="On",ALL(tbtesting))
YourAnswer:=CALCULATE([DistinctON],Filter(tbtesting,[TotalSalesON]/[DistinctON]>=[AvgON]))
Dear Catalin Bombea,
Big thank you for your help(^_^), all your help measure is working fine.
As me try and checking result incorrect, i think my question not clear

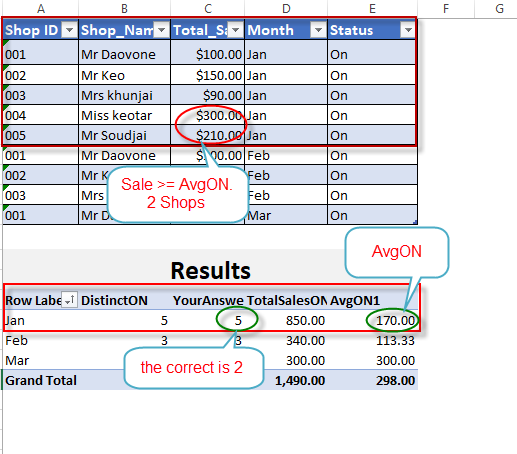
Let say: As above Pic for Jan
=> There're 5 shops Id (001, 002, 003, 004, 005)
=> Total Sales: 850$
=> Avg: 170$
In Jan there're 2 Shops Total Sales >= 170$ is (004:300$ and 005:210$)
(Mean in 5 Shops how many shop Total sales >=170$ as data of Jan)
You keep changing the pivot context, you had before shop ID, now you have month. Many times, if you change the pivot context, there is a good chance for a measure to stop working as expected, you have to adjust it.
Also, you are not using the AvgON measure I sent, yours is not accurate. If you want AVG measure to be aware of pivot context (to change the average on each row of the pivot), you can remove ALL(tbtesting) from the measure, otherwise the average will be across the entire table, ignoring row context.
Dear Catalin Bombea,
Big thank you sir, now i got the point and clear the top pic
