Good Afternoon! I feel a little "needy" posting another question here so soon, but here goes:
Now that I'm learning how useful Power Query and Power Pivot are, I'm trying to automate a lot of my department's monthly reports and KPIs. I'm having some trouble with the attached report. This report takes a valuation of every inventory item we have in stock across three plants (only two have been uploaded to the report so far: GLA & GSA) in the 'Inventory' Tab and compares the customer demand we have on items in our inventory from the 'Demand Tab'. I will be pulling these in from a folder where I upload the inventory and demand tables each month.
I then have to cross-reference the reports to get a total list of items in our inventory that are No-Use (have zero demand and will therefore be unused) and what the total No-Use cost is at each plant. This has been combined and calculated on the 'Report Data' Tab (No more VLOOKUP month-after-month, YAY!). I then present the report to my team and each buyer has to respectively categorize where items in their account fall within specified categories and then list the action they'll be taking to eliminate the unnecessary inventory. After each item is categorized, I then have to take the categorizations and formulate a pivot table for each plant showing how many NU dollars are held in each category at the respective plant.
I've validated the category column so that the buyer can select the appropriate category for each item from a drop-down list of applicable categories. The problem I'm having is uploading the buyer input into the data model (PowerPivot), so I can then use the category they've selected for each item and create the pivot tables that I need to for presentation to my corporate team. I've run testing and the way the connection are set now, anytime I select various categories and go into PowerPivot and refresh the data that column just clears any entries out because I created that column in PowerPivot. How can I set up the Data Model so that I can combine the two reports into the "Report Data" tab that I need to run, then give it to my team where they manipulate the data in the "Category" column, but still keep their entries to complete the next step of running the measure's and pivot tables on the data they've changed in the report?
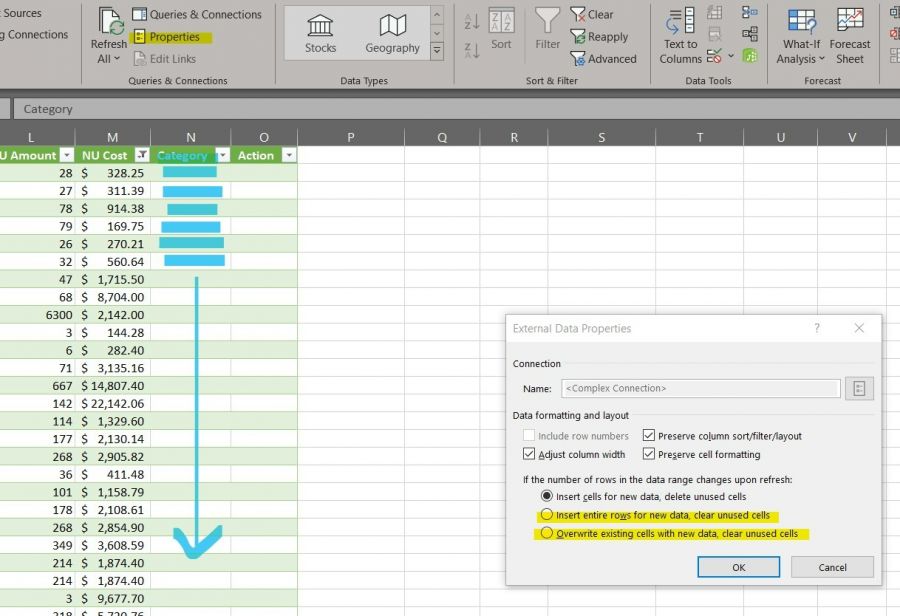
I've also attached a screenshot where I think I may have found my answer as I was typing this: If I chose one of the highlighted bubbles in the properties pop-up, will this allow their entries to upload into the model? The other idea I had was to create a new data source from this table, that's uploaded into the model, but I wasn't sure if I could create a 2nd data source from a table that was outputted from one of my reference queries.
Thanks in advance helping with this!
Okay--
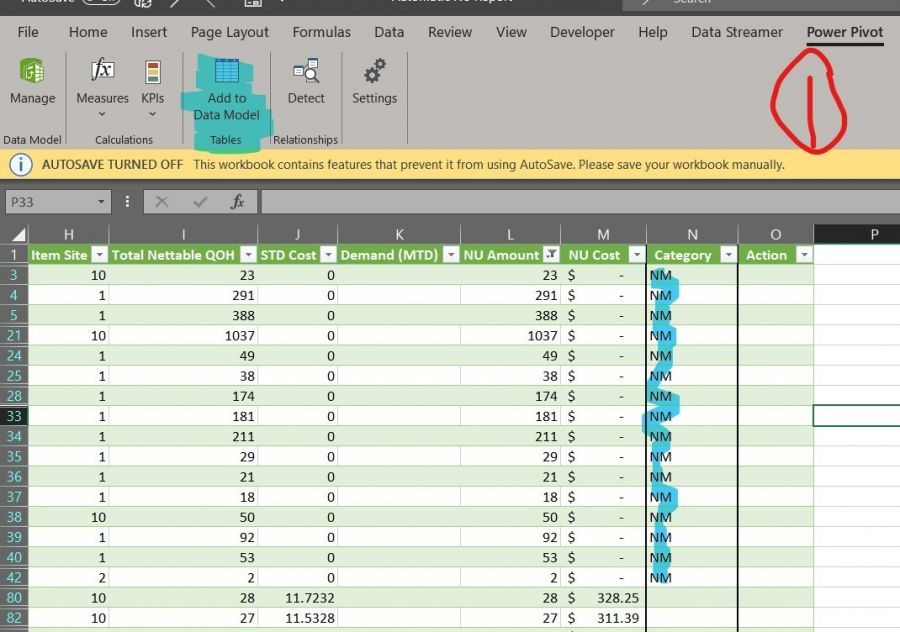
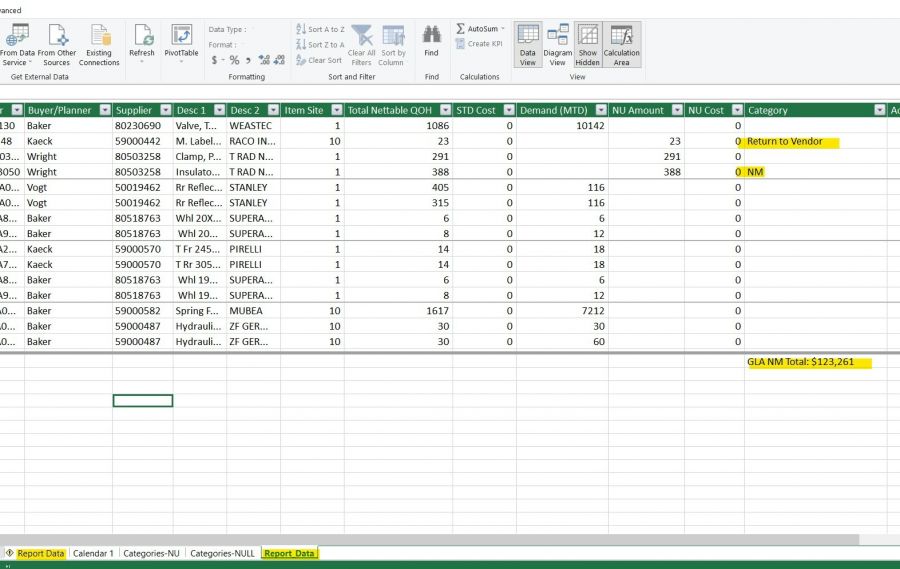
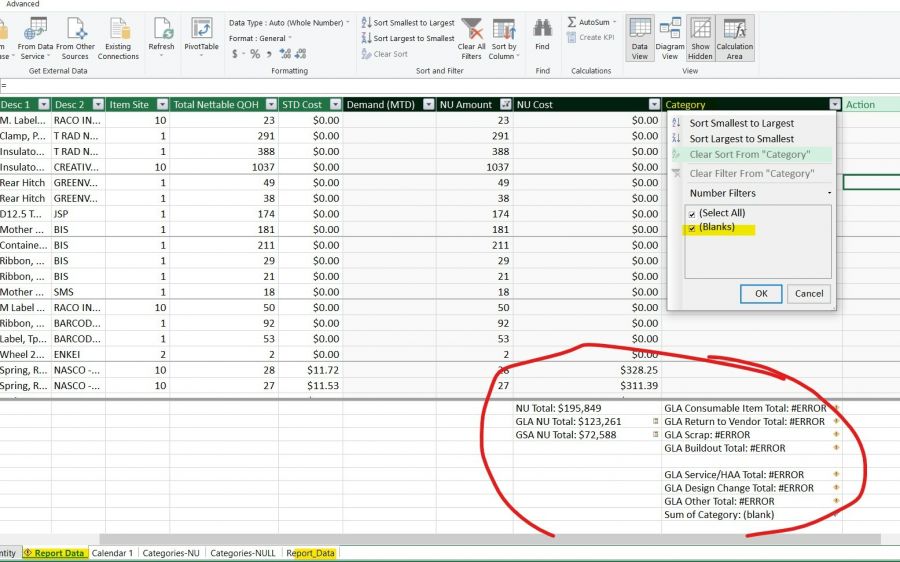
I think I found something out, I'm just not sure what. If I input some categories and then click "Add to Model", it takes the table and adds a 2nd tab to the PowerPivot model. Pictures below. The categories then appear on the 2nd model tab. But, when I refresh all, the categorizations disappear form the table. My KPI measures for each categegory do work in my 2nd tab/model.
How though, do I get this to just update the first model and keep everything on one tab and report rather than creating a whole 2nd tab that reports the same exact information... as well as the categories disappearing (I often need to go back and discuss and re-categorize with the buyer, depending on if dollar amounts in that category went up/down from one month to the last). I need to keep this all on the same tab/table for visibility, as well as ideally, keeping all the measures I've circled, all on one tab/model.


