Notifications
Clear all
General Excel Questions & Answers
2
Posts
2
Users
0
Reactions
1,134
Views
Topic starter
Hi
I have an abundance of seed packets, 50+. I'd like a database so I can easily see when to SOW, PLANT or HARVEST.
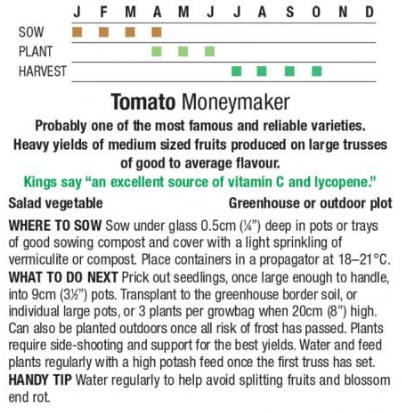
I don't know how to design it so I can filter on a month to see what can be done that month. See attached image,
SOW = Jan Feb Mar Apr
PLANT = Apr May Jun
HARVEST = Jul Aug Sep Oct

Thanks so much in advance.
Posted : 14/08/2023 7:21 am
Hi Kasey,
Your spreadsheet should have 3 columns:
- Plant Type (tomato, beans, corn etc.)
- Task (sow, plant, harvest)
- Month (enter proper dates e.g. 1/1/2024, 2/1/2023 assuming mm/dd/yyyy format)
Each plant will have three rows in the table, for sow, plant and harvest.
You can then use PivotTables and Slicers to plot the data in the format shown on the packaging with months across the columns and tasks down the rows. You can insert a Slicer for the Task and Dates (grouped by months) to filter the PivotTable.
I hope that points you in the right direction.
Mynda
Posted : 14/08/2023 7:10 pm
