Hi Mynda/Philip/Catalin,
First of all please allow me to send a big THANK YOU to you with all the EXCEL tricks and demos I have been learning since 2014!
I have run into a problem that I could not find the root cause of my dashboard (googled with lots of various keywords) hence I am here to ask for your help.
My question is, like all the finalized dashboards with many slicers and interactive graphs, all of my constructed pivot tables are connected, and the data source is the same and only, but later as I added new pivot table(s) from the very same source of data to allow users the search function, the filter from pivot table fields does not apply to existing pivot tables anymore, thus the graphs are not interactive (Refresh All button clicked). However, they still respond to all Slicers. I have defined my source a name though, so whenever I need to insert a new helper column I can just add and then include the new column in the Name Manager for the same defined name, hope that's not a problem.
I am very desperate and frustrated as this is how I was doing for the tables in the very same file earlier, but suddenly it does not work.
Thank you very much in advance!
Philip
Hi Philip,
Welcome to our forum. I'm trying to visualise the issue, but it's quite difficult to follow without your Excel file or even screenshots.
To be clear, if you're using the filter buttons on a PivotTable or Pivot Chart these filters are only applied to that one PivotTable/Chart. It's only with Slicers that you can filter multiple PivotTables/charts at the same time. Does that explain what is going on?
Mynda
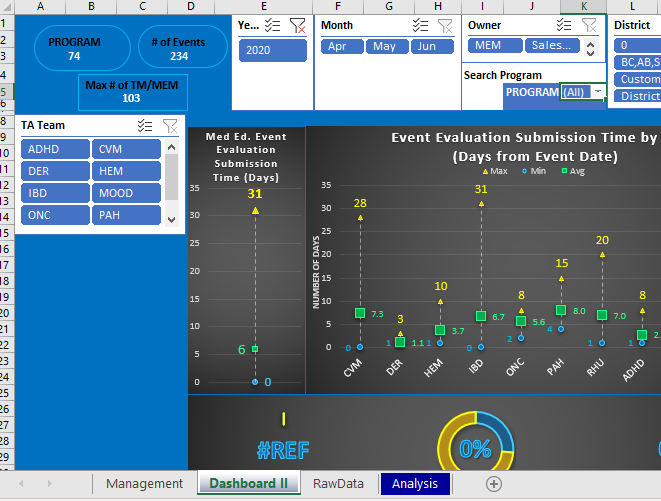
*Revised MGMT added Event Data Quality Dashboard - Copy.xlsx: Error 106 - Upload file size exceeds maximum allowed size. - reduced to 1 month data but still over the limit. Screenshot instead![]()

Hi Mynda,
Thank you so much for getting back my question with no time! I apologize for not sending you a file or screenshot as a demo in the beginning. I have uploaded this time*, however, and miraculously, Excel seems to fix the problem by itself over the weekend. Please allow me to describe what the problem was again with the file uploaded for your reference (if it does not bother you :)).
Background: In the "Management" A5, "Dashboard I" H5, and "Dashboard II" K5, there are PivotTables "Program Search" or "PROGRAM_NAME" to allow users to search by typing in program names as some basic operations. Dashboard I and II were the previously built tabs and Management was the addition.
Problem: After I added the Management tab and the PivotTable in A5, the filter was not corresponding to any of the graphs at all. I then checked and made sure all slicers are connected to the very same Data Source but the trick did not work. I tried the filters in H5 and K5 and they worked smoothly as before, and hence my confusion arose. I clicked "Refresh All" many times but it was futile.
Solution: Excel fixed the connections after I reopened the file and all tables are linked to the filter in the "Search Program" PivotTable. Note that I did close and reopen the application as well on Friday but no luck...
Thank you for your patience in reading along!
Hi Philip,
Use a free OneDrive account to store the file then share with us.
https://www.microsoft.com/en-au/microsoft-365/onedrive/online-cloud-storage
Phil
Glad you got it working, Philip!
