Greetings!
I'm not a power user of pivot tables, but I thought I was OK with the basics, and have been using simple ones successfully for some time, until today.
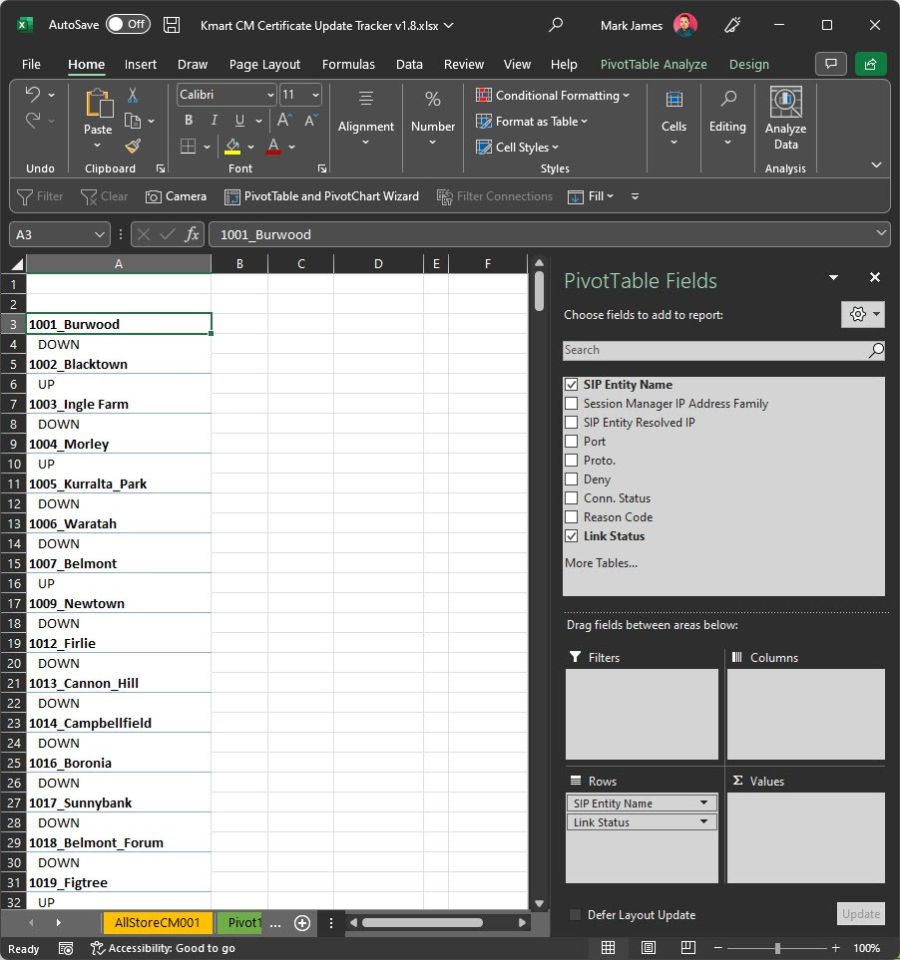
What happens is when I select a field to display, by default it drops into the ROW area and I see the data relevant to each row of my primary field.
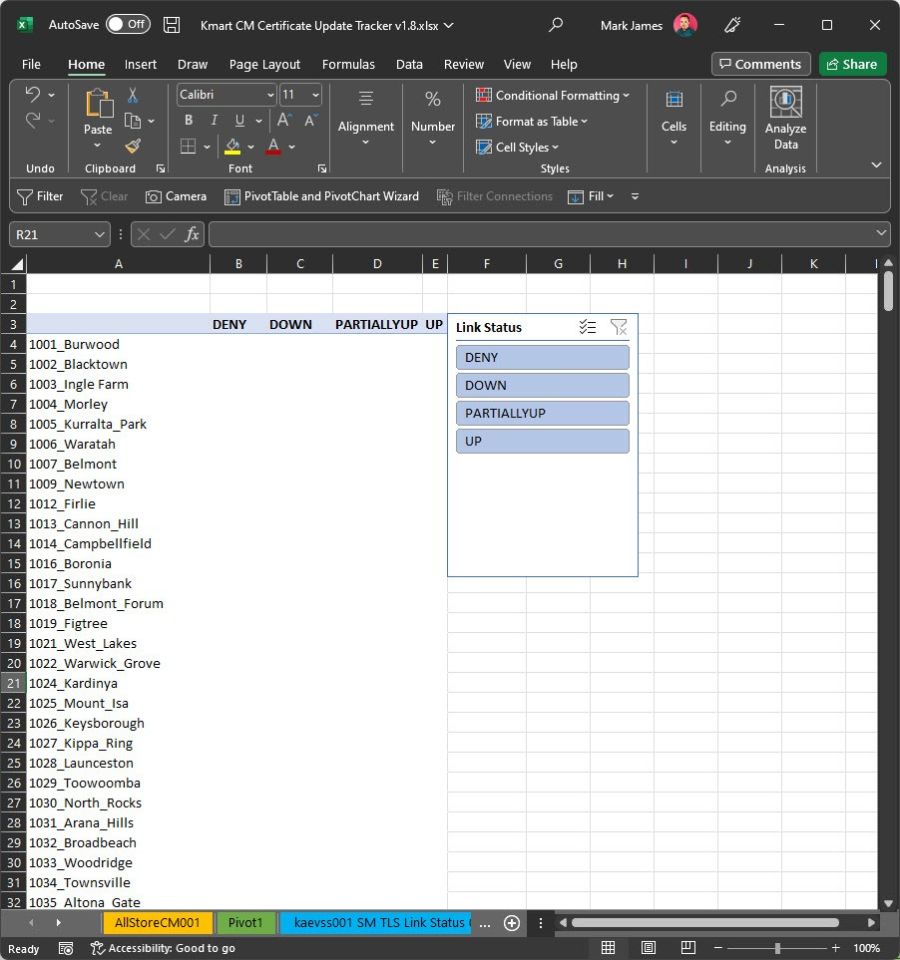
However, when I drag it into COLUMNS where I want it to be, the data disappears. Not one cell of the column has data displayed. I added a slicer to make it easier to see the valid values for 'Link Status'.
I have saved my data to a text file and re-imported it to Excel using Data > From Text/CSV and checked the data types under Power Query - they are all correctly detected.
Also the header cell for Column A is blank. It should contain the heading 'SIP Entity Name'
Any tips would be amazing. Thank you.


Hi Mark,
Neither of these screenshots have any data because you don't have any fields in your values area. It may appear that you have data in the first image because the link status is nested under the SIP entity name values, but there is actually no data in this PivotTable. Only row labels.
Try adding a value field to your second PivotTable e.g. you could left click and drag the Link Status field to the Values area and get a count of them (as well as have it in the row labels).
Hopefully that clarifies things. However, if you're still not getting the desired result, please post a mock-up of what you'd like to see in the PivotTable so we can understand your expectations and help further.
Mynda
Mynda,
Thanks that is very helpful.
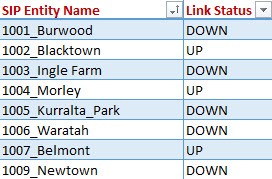
What I would like to display in the pivot is per the attachment.
I realise that I don't really need a pivot table to do this - I can just filter the Excel table, which is what I am going to do.
I don't want a count of Link Status, as that has no meaning for what I am using the data for.
Kind regards,
Mark.

