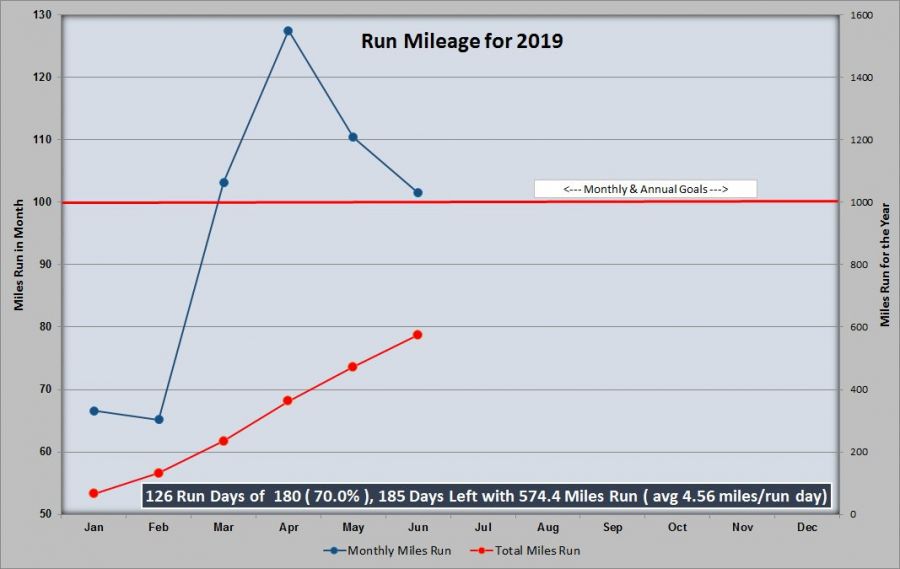
How do I add the information in a cell to a chart so as the information in that cell changes, the chart information changes too? I can do this through the Chart's Title assignment, which is how I included the information in the bottom of the attached chart, but I would like to include individual inserts instead of the single line. The second attachment shows the Title line I've used.
![]()
Hi Ric
One way is to copy-paste a linked picture of the range and then move it onto your chart.
Hope this helps.
Sunny
Thanks Sunny,
I want to be able to change the information in the Excel cell and have that change be also made automatically to the chart. I can do that a single time through the chart title assignment, but I would like to do it more than once. That is, right now I have to crowd all the information on a single line.
Hi Ric
Maybe I am not too clear about what you wanted.
It would be better if you can attach what is your expected result, preferably an Excel file with some test data.
It will help us understand your needs better.
