Good day to everyone,
Hope you are all doing well!
I am here once again to ask for your help on how to create an Excel dashboard about my comparison of Actual and Budgeted Sales. Please see the attached file for my sample data, i can not attach the excel file and can only attach the picture.
Thank you very much, hoping for your help.
Norman.
Any reason why the file is an "xls", rather than "xlsx"? That's an ancient format.
I've saved it as an xlsx and used Power Query to flatten and append both the actual and budget data.
In the Report sheet I created some crude pivot tables just as an example. I hope it helps you on your way. If not, come back here but please be more specific regarding your needs/requirements.
@riny Thank you very much. you provide good report. but i want to compare the budgeted sales and actual of each customer by the services rendered. For example, CUST-0001, DIVISION A, there is budgeted sales on service 1 (10000) and service 3 (5000) compared to actual sales on service 1 ( 7000) and service 3 (2000). how to do the comparison?
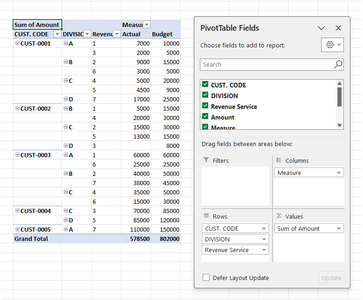
@norman Well, then you create a pivot table that has all three elements in the row area. Something like this:
Added it to your file.
Are you familiar with pivot tables and Power Query?


