Good Afternoon,
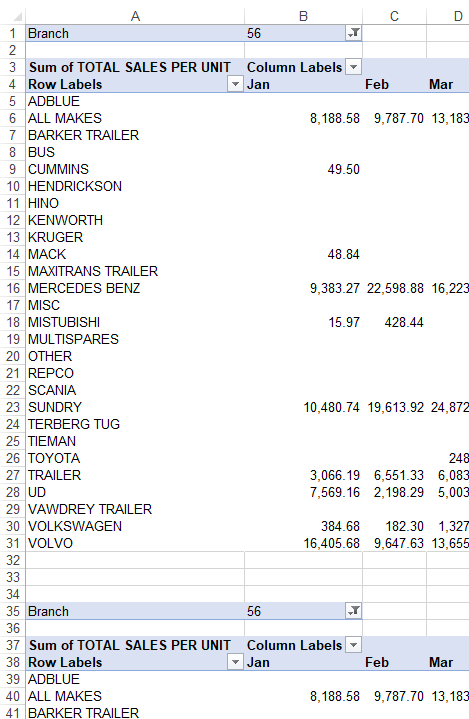
I have created a dashboard which includes the sparklines to show trends between branches but when I change the slicers all the pivot tables in my "Sparklines Pivot" tab change to the same branch instead of being separated.
This screenshot below was "ALL" at the top and then the next one should show 56 but they all have changed to branch 56 (total of 8 branches/ pivot tables).
Is this something easily fixed? My excel file is a little too big to upload. Thanks for taking a look!

Just right click on your slicer and click "Report Connections" and unclick any pivot tables you don't want the slicer to control. Attached is a screenshot of a connection list for one of my slicers. Hope this answers your question.
Thanks Jessica,
I thought they all had to be linked ! I've unticked them and it seems to be working 🙂 Many thanks !
