Hello Mynda,
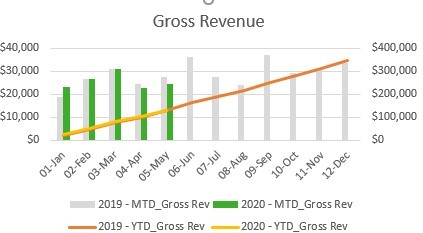
I have a very simple combo chart that I track MTD (cluster column) and YTD revenues (line secondary axis) for 2019 and 2020 (image combo1).
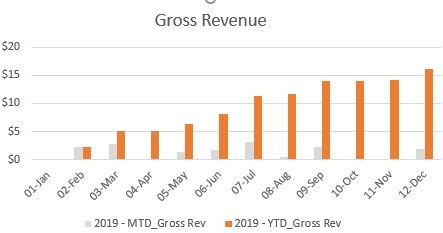
When I change the slicer to a location where there is no 2020 data, the chart changes to regular cluster column chart and MTD and YTD values become cluster columns on the same axis (image cluster1)
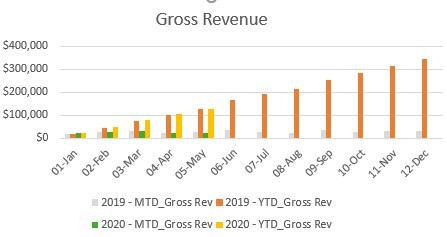
When I change the slicer back to the original selection, combo chart does not come back, and 2019 and 2020 MTD and YTD values display in cluster columns on the same axis (image cluster2)
Is there a way to retain/fix the chart type so no matter what the data becomes in the pivot table, chart type remains as "combo"?


Thank you,
Petek
Hi Petek,
Welcome to our forum!
This is a known issue with combo Pivot Charts. You can try editing the date/year field settings to 'show items with no data' to see if that helps. If not, I recommend building a regular chart from a PivotTable.
Mynda
