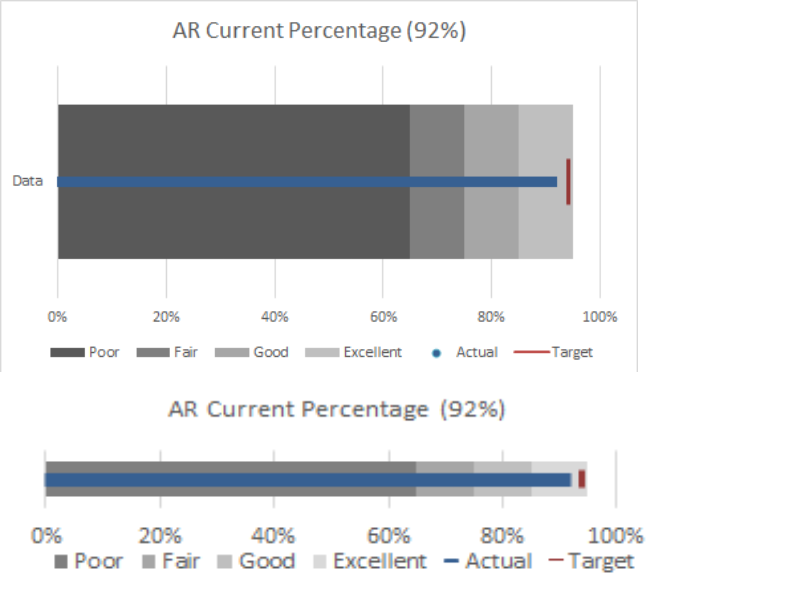
See the attached image. This was while trying to create a horizontal bullet chart. I was totally done then realized that the tiny squares for the legend had somehow grown to long bars and I couldn't get them back to squares. I used Excel's Undo (2016) about 50 steps and saw when it happened - very early when I was adding and tweaking the Actual and Target data.
But even clicking Undo/Redo I couldn't figure out what it was I was doing. I finally gave up and started over, and got it right on the 2nd image. The bars in the legend were so big when I got to the point of resizing the actual bullet chart part, the legend wanted to take up 2 rows of data, which made it useless. The image shown below is when I clicked "redo." For some reason, Excel let me go back much further than it let me go forward so never got it back to the almost-final chart.
However, I'd like to know what I did to cause this, how to avoid, and how to fix.
The google did nothing for me when I searched for stuff along the lines of: change bar size excel legend: and similar keywords.
The stuff Peltier did to come up with this is nothing short of amazing... You really have to pay attention when you are in "Format Data Series" and "Format Data Point" when hiding markers in the chart but not the legend.

Hi Ed,
No idea, but I wonder if you changed any of the chart types to a line chart in the process? Maybe this affected the legend.
Otherwise, I've not had that problem before.
Mynda
That was partially it! My "Target" chart type was changed to a "Scatter with Straight Lines" vs a "Scatter." I didn't select that on purpose. When I changed it to a Scatter, they shrank back to the boxes. Thanks for the pointer on where to look.
