Hi
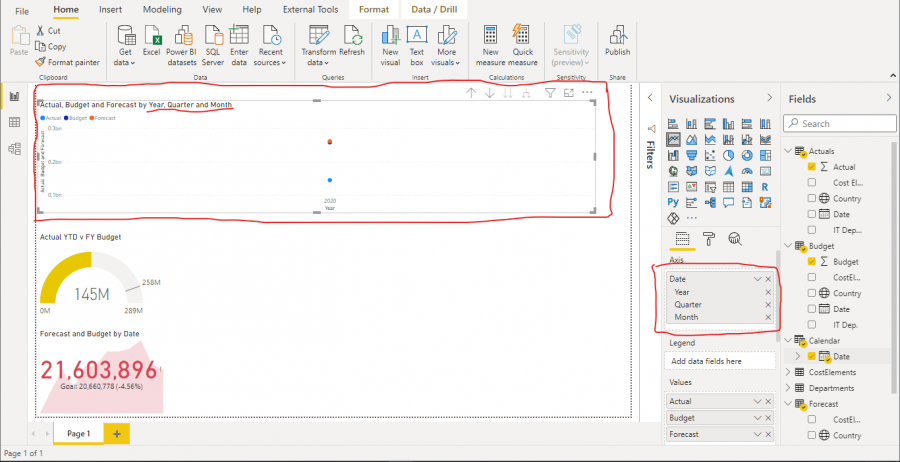
The values for month and quarter wont display on the "Actual, Budget and Forecast by Year, Quarter and Month" line chart visual i created while trying to recreate this PowerBI dashboard Mynda created in this tutorial How to Build Power BI Reports from Start to Finish.
I have attached an image of what i am getting and the PBIX file.
Hi Ng,
Welcome to our forum.
You'll notice you only have data for January in your file. In order to draw a line you need at least two months or two quarters or two years of data to join the dots.
I suspect your system uses date format mm/dd/yyyy whereas mine uses dd/mm/yyyy. If so, you need to go to the first Changed Type step in Power Query and delete it. Then right-click the date columns (one by one) and choose 'Change Type' > 'Using Locale...' > select Date for the data type and 'English (Australia)' for the locale.
Mynda
