In my last tutorial I showed you how to insert a Subtotal using the Subtotal tool.
If you’ve read that tutorial you will have seen how Excel can also conveniently Group and Outline your data so you can easily group and ungroup the rows to see varying levels of detail.
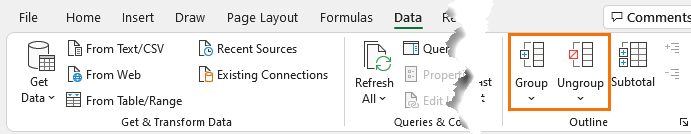
Thankfully you can insert these handy groups without having to insert subtotals. You will find the Group and Outline Data buttons on the Data tab in the Outline group right beside the Subtotal tool.
Watch the Video

Download Workbook
Enter your email address below to download the sample workbook.
How to Insert a Group and Outline
1. Select the rows or columns you want to group together.
2. Click on the Group button.
3. You’re done!
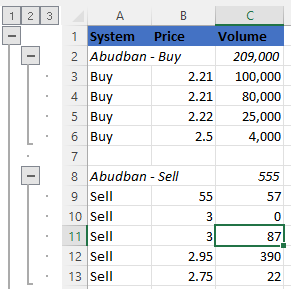
You should now see the outline symbols  and the
  and
and  buttons.
You can either click on the + and – buttons to hide or unhide the rows in the group, or you can click the outline symbols.
You can add up to 8 levels to your outline by grouping rows within an existing group. The more levels of groups the more outline symbols you will have.
In this example we’ve looked at grouping rows, but you can also group columns in the same way.
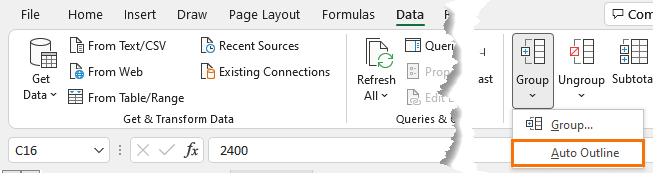
How to Insert an Auto Outline
The Auto Outline works by identifying summary rows (rows that have formulas calculating a subtotal) in your data immediately below or above each group of detailed rows or columns. I don't see much point in using this feature for rows as you may as well use the Subtotal tool and have it do the whole job for you.
However, if you've got columns that you want grouped then Auto Outline is the tool to use as Subtotal only works on data laid out in a columnar format. i.e. Data with column headers with your data underneath.
How Remove a Group (Ungroup)
1. Select the rows or columns you want to ungroup.
2. Go to the Data tab and click on Ungroup in the Outline group.
Alternatively if you want to remove all groups go to the Data tab and click on down arrow on the Ungroup button and select Clear Outline.
Cool Tricks You Can Do With Groups
Copy the Outlined Data Only
1. Group your data to show the level of detail you want to copy.
2. Select the range of cells you want to copy.
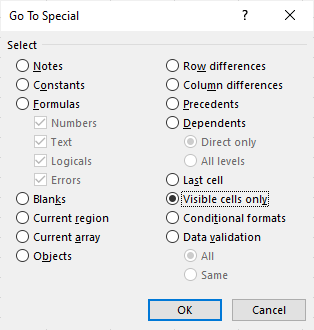
3. CTRL+G to open the Go To window.
4. Select Special.
5. Click the Visible Cells Only radio button and click OK.
6. Now you can copy and paste.
Create a Chart from the Summary Levels Only
1. Group your data to show the level of detail you want to chart.
2. Insert Chart. (if you don’t know how to insert a chart sign up for our free training)
Now when you expand or contract your data your chart will dynamically update to match the level of detail displayed in your data.
Hide the Outline Symbols
You might want to send the workbook to someone as a report and you don’t want them to see the detailed data.
You can easily hide the Outline Symbols so they can’t use them.
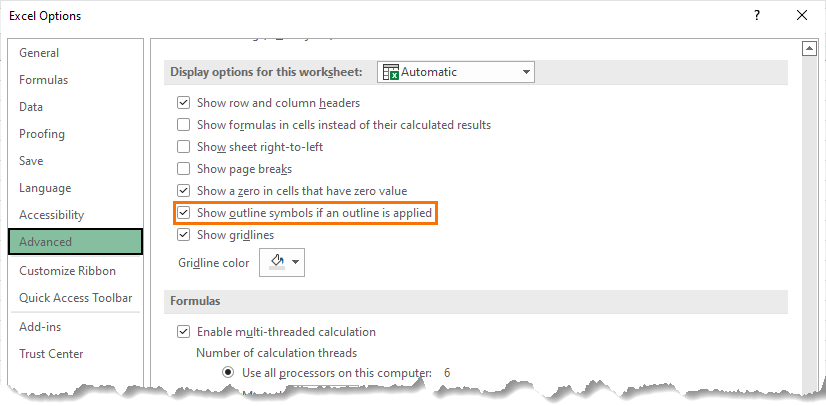
1. Go to the File tab, click Excel Options, in the Advanced category under Display Options for this worksheet section, un-tick Show outline symbols if an outline is applied.
Use Outlines Instead of Hiding Rows and Columns
I often find when I hide rows or columns that I’m forever unhiding and hiding them again.
If this happens I prefer to use Groups as I can easily expand and contract my columns or rows.
Ok, so it’s only 2 less clicks but in Excel it’s light years….alright, slight exaggeration, but if you’re like me every click I can save is worth it.


I love this feature but want a way to label each group so that when they are collapsed I know which group to open.
Hi Leonard,
If you use the Subtotal tool on the data tab it will insert the outline and subtotal rows. Then when the groups are collapsed the subtotals are still visible.
Mynda
Thank you
Mynda,
Good stuff! I am trying to make multiple independent groups within rows or columns. Not subgroups but groups that I can manipulate independently of each other. For example, within a worksheet of servers, I want to group servers from organization ABC in one group that I can turn on and off and servers from organization XYZ in another group that I can do the same thing independently. Currently using Office 2010 and 2013. Don’t even know if the capability exists. Ready, ready…Go.
Thanks!
Hi Torch,
Sounds possible. Let me know if you get stuck.
Mynda
I couldn’t get it to give me multiple independent groups but it was easier to add a column, categorize the entries and filter them as necessary. Sometimes the old ways are the best ways!
I have an Outline, and this just happened recently when they had to fix my PC at work. In the upper left hand corner of my worksheet are the Outline #’s. 1,2,3 for the rows and 1,2,3 for Columns, etc.
When I zoom OUT to view my worksheet, these numbers disappear or shrink so small I can’t see them. How can I fix that.
Hi Mike,
I’m not sure you can change this since the rows and column labels need to resize in line with the cells and likewise the zoom buttons.
Perhaps you can put some bigger buttons on your worksheet with a macro linked to the 1,2,3 buttons.
I hope that helps.
Kind regards,
Mynda.