It's often useful to know some quick statistics about our data. Things like the minimum or maximum values, or the distinct count of items in a column.
These statistics and more can be quickly and easily obtained using the Power Query function Table.Profile.
Watch the Video

Download Workbook
Enter your email address below to download the sample workbook.
Table.Profile
For every column in a table (where applicable), Table.Profile gives this information:
- Minimum
- Maximum
- Average
- Standard Deviation
- Count
- Null Count
- Distinct Count
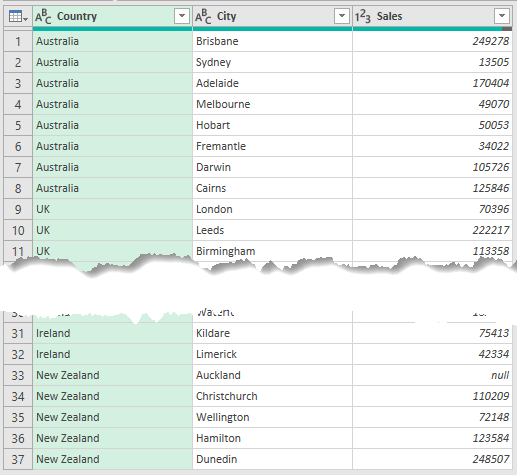
Lets say we have some data in a table that shows sales figures for various cities in the countries where our global mega-corp has offices.
Load this into Power Query with a query I've called Locations giving us this table.
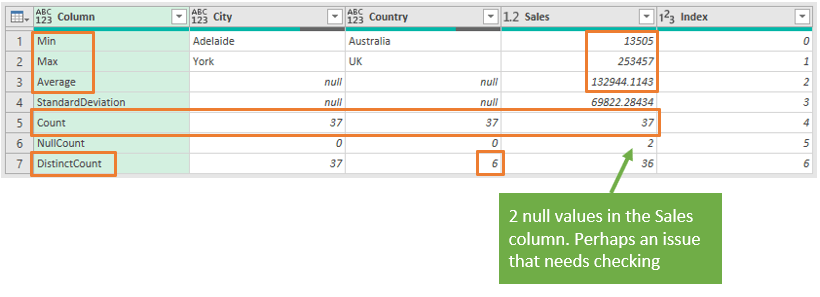
I can create a new query that I'm calling Stats, that for its Source step uses the Table.Profile function on the output of the Locations query. We end up with this table of statistics for the Locations table.
I can make the table a little more readable by demoting the header row, transposing the table and then promoting headers again, to end up with this
I've added an Index column because I'm going to show you a way to access these stats that will use these Index numbers.
So we can see right away the min, max, average etc for the Sales column. We can see min and max for the text columns (City and Country) which in some cases can be useful with text columns.
You can see the Count for cities, countries and sales is 37, meaning we have 37 rows. The Distinct Count for the Country column tells us that we have data for 6 countries.
The NullCount for the Sales column is 2, so there are 2 rows without a Sales value. Might be something wrong there so best check that.
Accessing Table.Profile Statistics in Other Queries
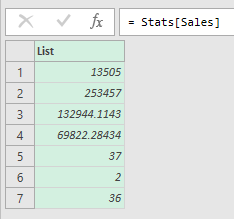
Every column in a table is a List. So if I refer to Stats[Sales] I'll get this list
To get the maximum value in the Stats[Sales] column I can do so like any other list, by using an index number to access the value. Looking at the table where I added the Index column, and as lists are indexed from 0, the max value would be at position 1 which is accessed in M using Stats[Sales]{1}
To get the average sales value you would use Stats[Sales]{2}, or to get the distinct count of countries you'd use Stats[Country]{6}
You can access these statistics directly inside your queries to either do some quick checks on your data, or you could use these values in your Excel reports or in visuals in Power BI.
I know there are other ways to calculate such statisics on your data but Table.Profile can be very handy as it provides commonly needed stats very easily.


I have a SharePoint list with details of issues that each person fixed. If the issue is fixed, then a text value either ‘Pending,” “yes” or “no” is assigned for each row. I extracted the list using a Power query and then, I am then using power query data to create a pivot table. In my pivot table, I want to count the number of yes for each person. The pivot table counts only if it is blank or not blank. It is not giving only the count of yes for each person. please help
Please post your question on our Excel forum where you can also upload a sample file and we can help you further.