Power Query, Power Pivot, VBA, and Office Scripts, you’ve likely heard of them all. But knowing when to use each one? That’s where many Excel users get stuck.
In this guide, we’ll break down what each tool does best, when to combine them, and common mistakes to avoid. By the end, you’ll have a clear roadmap for choosing the right tool for the job.
Table of Contents
- Watch the Power Query vs Power Pivot vs VBA Video
- Get the Quick Reference Guide
- What Each Tool Is Best At
- When to Use Each Tool
- Power Query: For Cleaning and Reshaping Data
- Power Pivot: For Modelling and Analysing Big Data
- VBA & Office Scripts: For Automating Complex Tasks
- Side-by-Side Comparison
- When to Combine Tools
- Take It to the Next Level: Power BI
- Ready to Go Deeper?
- Final Thoughts
Watch the Power Query vs Power Pivot vs VBA Video

Get the Quick Reference Guide
Enter your email address below to download the free file.

1. What Each Tool Is Best At
Let’s start with a quick overview:
- Power Query: Your data janitor. Great for importing, cleaning, and reshaping data from various sources - fast.
- Power Pivot: Your data brain. Designed for analysing large datasets using relationships and powerful DAX formulas.
- VBA / Office Scripts: Your Excel robots. Perfect for automation when built-in tools fall short - but they require coding and can be fragile.
2. When to Use Each Tool
Power Query: For Cleaning and Reshaping Data
Use Power Query when:
- You receive messy data (Excel, CSVs, PDFs, etc.) regularly.
- You spend more than 5 minutes manually cleaning or reshaping data.
- You repeat the same data prep steps and wish Excel could “remember” them.
- You need to merge, unpivot, transpose, or handle large data files.
Real Example
Each month, you receive sales reports in the same format but with updated data. Power Query can:
- Point to the folder where the files are saved,
- You show it how to clean and transform one file,
- Power Query then applies the same logic to all files in the folder and any new files,
- Update your reports with just one click.
Want a hands-on demo? Watch this Power Query tutorial
Power Pivot: For Modelling and Analysing Big Data
Use Power Pivot when:
- You're working with multiple related tables (e.g. Orders, Customers, Products).
- You need to analyse hundreds of thousands or millions of rows.
- You want to build dynamic dashboards with slicers and timelines.
- You need time intelligence calculations like:
- Year-over-Year (YoY)
- Month-over-Month (MoM)
- Weighted Moving Averages (WMA) etc.
Real Example
Instead of using X/VLOOKUPs to combine tables, load your data into Power Pivot, define relationships, and use DAX formulas to summarize insights cleanly and efficiently in PivotTables.
Pro Tip
Use Power Query to prep the data → load it into Power Pivot → build dashboards that update with a single click.
Common Mistake
Failing to set up table relationships properly. This breaks your model before you even begin.
See Power Pivot in action: Watch this introduction to Power Pivot tutorial
VBA & Office Scripts: For Automating Complex Tasks
Use VBA or Office Scripts when:
- You want Excel to email reports, save copies, or generate PDFs automatically.
- You need user input forms or pop-up messages.
- You want to trigger actions with buttons or events.
- If you’re working in Excel for desktop – use VBA or when working in Excel Online – use Office Scripts.
Common Mistake
Using VBA for tasks better suited to Power Query (like cleaning data). Always try built-in tools first.
Start automating with VBA: Macros & VBA for Beginners
Start automating with Office Scripts: Write Excel Office Scripts with ChatGPT
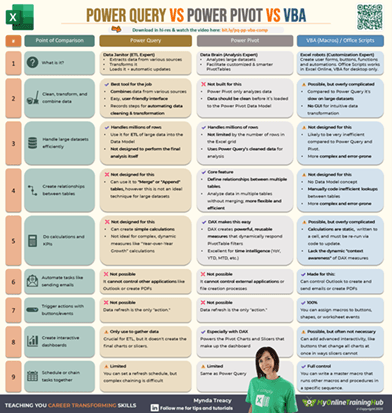
3. Side-by-Side Comparison
Here’s a quick reference to help you decide which tool to use:
| Task/Need | Power Query | Power Pivot | VBA / Office Scripts |
| Clean & reshape data | ✅ | ❌ | 🚫 (possible but complex) |
| Combine files or tables | ✅ | ✅ (via relationships) | ❌ |
| Analyse large datasets | ✅ (import) | ✅ (model/analyse) | ❌ |
| Create relational data models | ❌ | ✅ | ❌ |
| Perform advanced calculations (e.g., YoY) | ❌ | ✅ (DAX) | ❌ (not ideal) |
| Automate emails, PDFs, form input | ❌ | ❌ | ✅ |
| Trigger actions on events/buttons | ❌ | ❌ | ✅ |
| Build interactive dashboards | ✅ (import) | ✅ | ❌ |
| Chain/schedule tasks | ❌ | ❌ | ✅ |
Get the hi-res quick reference guide version of this table here.
4. When to Combine Tools
The best results often come from combining tools strategically. Here are a few winning combos:
Power Query + Power Pivot
Best for: Scalable dashboards
Why: Power Query cleans, Power Pivot analyses
Example: Monthly sales files → Power Query transforms → Power Pivot builds MoM/YoY dashboard
Power Query + VBA
Best for: Automating data refresh
Why: Power Query prepares data, VBA automates updates
Example: Weekly CSV data → VBA opens and refreshes query overnight → Report is ready when you log in
Power Pivot + VBA
Best for: Automating report generation
Why: Power Pivot calculates, VBA distributes
Example: Power Pivot summarizes financials → VBA exports PDF views → VBA emails reports to stakeholders
5. Take It to the Next Level: Power BI
Once you’ve mastered these Excel tools, the natural next step is Power BI - a tool designed to take your dashboards and automation even further.
Watch this beginner Power BI tutorial: Build interactive dashboards that update automatically, no manual work needed.
Ready to Go Deeper?
If you want step-by-step training on any of these tools, check out:
These courses are packed with real-world examples and include personal support to get you up and running quickly.
Final Thoughts
Power Query, Power Pivot, VBA, and Office Scripts each solve a different piece of the Excel automation puzzle. Learn to pick the right tool (or combination), and you’ll save hours every week, all while building cleaner, smarter, faster workbooks.

Fantastic.
Glad it was helpful, Peter.