Hi,
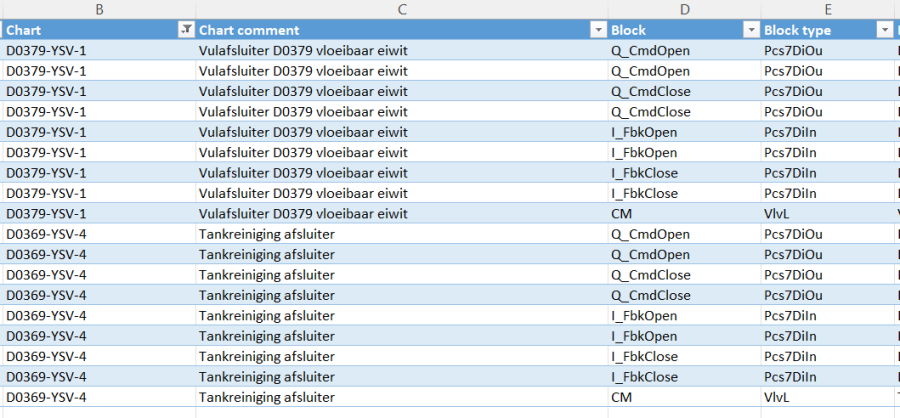
In the attachment is a table. I want to check each row in column Chart to find a unique chart. For the unique chart I want to check column Block type by finding value: "VlvL". If this matches, I want to enter a value in a new column containing text "VlvL" for all rows with the unique chart name. If "VlvL" is not found in block type, then text: "N/A" must be entered.
How can I do this? I found some examples with the index function, but it's all about two tables. How can I do this for one table?

For clarity, you have posted your question in the Power Query section, though you mention having looked at the INDEX function. That makes me believe you are actually asking about regular Excel functions, i.e. not Power Query.
Correct?
If so, what Excel version are you working with? And then regarding the question itself, what do you mean by "to find a unique chart"?
In the screenshot, there are two items with "Vlvl" in column E. Based on what criteria would you want to create the new column?
Perhaps some like this (using a structured table reference):
=IF([@[Block type]]="Vlvl","Vlvl","N/A")
though this formula does not take any specific unique chart code into consideration.
In case you are working with dutch Excel the formula should probably read:
=ALS([@[Block type]]="Vlvl";"Vlvl";"N/A")
Hi,
I'm using Power Query, the index, match function is something that will get the job done I think, but I cannot get it to work in power query...
Just to clarify:
For all rows with the same value in "Chart", if Block type = VlvL is found in one of the rows then text: "VlvL" in custom column for all rows with the same chart name, else text "N/A".
Okay, got you now. See attached and let me know in case you get stuck when you apply this technique of merging a table from one step with a table that results from another step.
