Hi fellow lovers of Excel Power Query
At my work place departments and department codes are stable and unique. At worst a new department gets it's own unique department code.
Employees has got a unique employee #, but a number of them rotate from one department to another.
My issue is to make a stable data model, where I can get data from each department and each individual employee month by month with information like hours worked, completion number of days of holiday, days sick and more. Data are all in unique files and gotten into my main file throuhg Power Query - "Get and transform".
All used values are created as measures.
I have tried a number of different solutions, but each time I run in to a problem with non-unique values causing to show the same value in all departments.
I really hope to find someone out there, who can give me the solution to combine data from.
Thanks
Erik
Does the Employee table have multiple rows for the same employee but working for different departments?
If so, rename that table to e.g. Assignments. That will be your transaction table. Create a separate table for Employee only data. One row per employee.
Then you will have two dimension tables (Departments and Employees) and one transaction table (Assignments).
Create the appropriate relationships and be sure that you only use the fields from the dimension tables to select Departments and/or Employees.
If all of this doesn't seem to make sense, could you please upload a file with some example (non-confidential) data.
Hi Riny
I got that far myself, but the problems started with the different data regarding - hours worked, completed days of holiday, days sick and so on.
Data are in seperate databases, so I have my data model with unique departments, employees and a number of lookup tables for keys to the data mentioned above.
But I fail to find a one-to-many connection to one data table.
Difficult to help if you don't share a file.
With a simple example file, where employee# is the common denominator, I hope to be able to illustrate the challenges I'm facing with data from work.
Data is for the most part on employee number, and that makes it difficult to build a solid data model.
Hope is that someone out there can give me some good advice.
Thanks
There is no attachment. Please try again and don't forget to press "Start upload" before you submit your reply.
Trying to upload again
See attached!
The problem is that you can't filter from the SickDay table 'up-stream' towards the Employee/Department table to calculate the number of sick days per employee by department. You need to create what you could call a virtual relationship between the two tables based on the one column they have in common, i.e. Month. To achieve that you can use the TREATAS function.

Hi Riny
Thanks a lot.
My plan was to be able to make a profile for each department and each individual employee.
Guess I can use your tip on "units produced" and other data files ?
Took the solution to work only to find out, that TREATAS isn't working there - Excel 2016 32 bit is the "tool", I have to work with there.
Hope somebody out there can give me advise on another solution.
To recap - databases at work are all with either employee # or/ and codes (keys) for departments.
Some employees rotate from one department to another from time to time, we frequently get new employees while others leave us.
Databases are among others - hours worked, production with a number of different keys for products, vacation days, maternity leave, days absent because of sickness and hours used on training/ education.
It is not possible to combine databases on the source level.
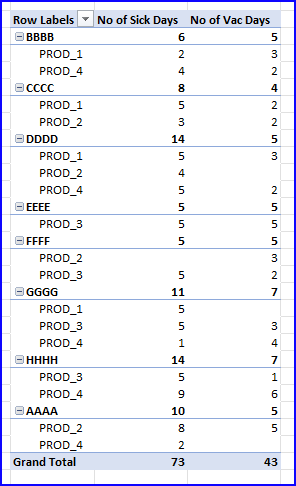
Sure, you can create a combined table by using VLOOKUP and then make sure that every table has the employee code and the department code in it based on the date.
I added a table to your workbook and a regular pivot table. Would that work for you? You can also do something similar in the data model, but if you can't use TREATAS you need to use helper columns.
