Hi everyone,
I have an issue where I have a two tables and need to be combined together, first one is the description of Profit and Loss and second table is the raw data . The complication that I have is where In the Profit and loss has a subtotal. In the first table(GL Description) you will see there is a subtotal for A, which is summing A1 + A2 + A3 and Subtotal B (B1+ B2) and Subtotal C (C1 + C2 + C3) and Grand Total (A + B + C)
Is this possible to use both power query and power pivot to generate the result shown in row 18 onwards ?
Much appreciated for your help.
Thanks
Albert
Hi Albert,
You would have to introduce a grouping element so that Excel knows which GL accounts belong together. Maybe you can do that by taking the first two or three digits of the account number based on some other logic. I just inserted a column for the "Category" and simply used a, b and c.
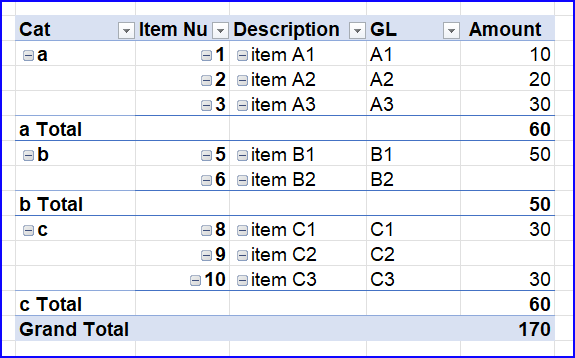
In PQ, I removed the Sub Total and Grand Total rows from the GLDescription table and merged it with the RawData based on GL code. Expand the merged table and load to a PivotTable. Please see the file attached for the end result looking like this:

