Could someone please explain how to calculate a rolling average for a column of numbers in power query.
I think I need to add an index column and use this with list.average in a custom column but I can't work out the correct syntax.
I've looked online but all the examples I've found seem to be for Power BI and I'm using Excel.
Thanks

Hi Andy,
There are a few ways to do it but the easiest would be to add an Index column starting from 1, then use List.FirstN to get the items in the column up to the current row, sum them, and divide by the row number (given by the Index column)
List.Sum(List.FirstN(#"Changed Type"[Value],[Index]))/[Index]
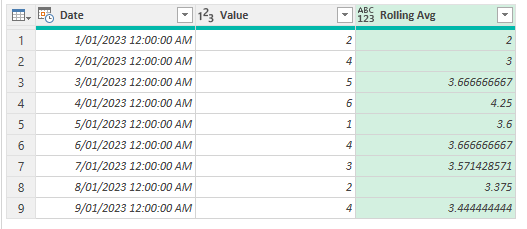
See attached file for example
Regards
Phil
Thanks Phil,
That makes sense.
I realise now though that I haven't asked my question correctly!
Maybe what I'm after is correctly called a moving average of a specified number of values.
Please see my attached file as an example.
Here, the first 4 rows are averaged, then rows 2,3,4,5 are averaged, then rows 3,4,5,6 and so on.
I'd like to know how to do this in power query.
My apologies for not making this clear.
Regards,
Andy

See attached!
Nice one Riny!
Thanks,
Andy