Hi All,
I'm using microsoft 365 on windows. I have a file try to create a connection between 2 different database.
but when i try to make pivot table for cutting, ppa and others section show as sum.
please view below link for example file.
Thank you.
Warm Regards,
Justin R
Cannot determine what your issue is. Two tables seem to have relationships and you have created a PT. What are we missing in your explanation?
Hi Alan,
oh i think my file error. i don't know why my PT it's not show any data.
here i send some picture.
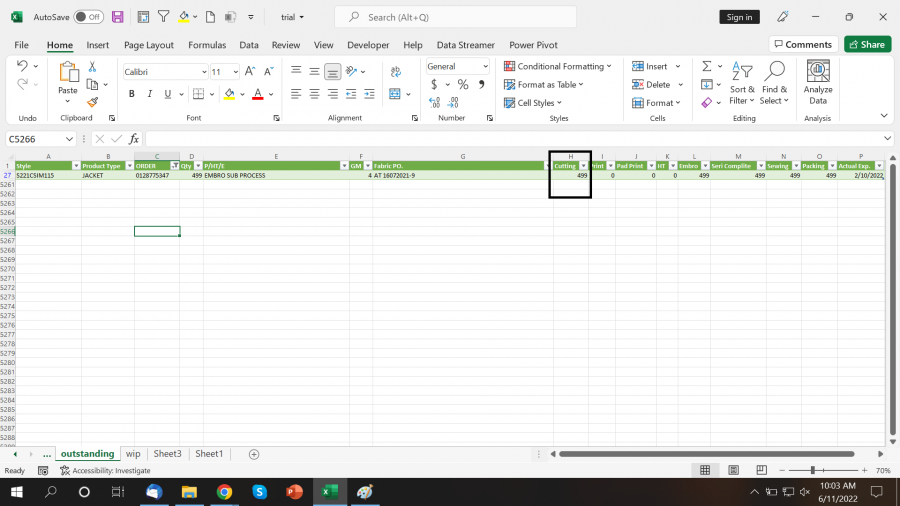
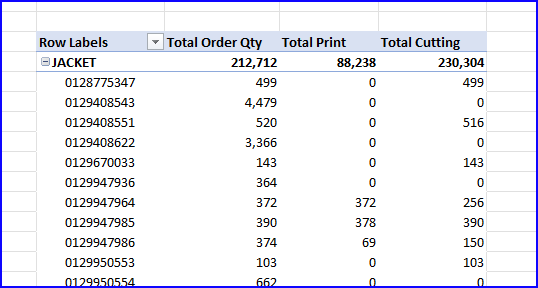
in the database the Order cutting output is 499 pcs. but when look at the PT its shown wrong data. and for all order have the same number for cutting.
and when i try to create connection it's can't.
![]()
Warm Regards,
Justin R
Hi Justin,
Couldn't work with the file in the link as it connected to a source on your own computer. Though, I took the two tables (outstanding and WIP) and recreated the model that you described. However, I thought it made more sense to link the two via "PO Numbers", so I removed the relationships based on "Work Number". Furthermore I worked with some DAX measures. Partly, to make it more structured and party because you need to relate the Qty in the 'WIP' table to the product types in the 'outstanding' table. I used a trick that I picked-up from a paragraph in an article (link below) labelled as "Italian Black Magic", based on Marc Russo's work. You need to scroll about a third down).
The particular measure in the attached file is the one for Total Order Qty:= CALCULATE(SUM([Order Qty]), outstanding) in the WIP table.
https://exceleratorbi.com.au/many-many-relationships-dax-explained/

It seems to accomplish what you need.
The file is too big for uploading here, so the link below takes you to a shared file.
Hi Riny,
Yes, that's was i really need. really appreciate for your help.
Thank you & Warm Regards,
Justin R
