• Skip to main content
  • Skip to header right navigation
  • Skip to site footer

My Online Training Hub

Learn Dashboards, Excel, Power BI, Power Query, Power Pivot

  • Courses
  • Pricing
    • Free Courses
    • Power BI Course
    • Excel Power Query Course
    • Power Pivot and DAX Course
    • Excel Dashboard Course
    • Excel PivotTable Course – Quick Start
    • Advanced Excel Formulas Course
    • Excel Expert Advanced Excel Training
    • Excel Tables Course
    • Excel, Word, Outlook
    • Financial Modelling Course
    • Excel PivotTable Course
    • Excel for Customer Service Professionals
    • Excel for Operations Management Course
    • Excel for Decision Making Under Uncertainty Course
    • Excel for Finance Course
    • Excel Analysis ToolPak Course
    • Multi-User Pricing
  • Resources
    • Free Downloads
    • Excel Functions Explained
    • Excel Formulas
    • Excel Add-ins
    • IF Function
      • Excel IF Statement Explained
      • Excel IF AND OR Functions
      • IF Formula Builder
    • Time & Dates in Excel
      • Excel Date & Time
      • Calculating Time in Excel
      • Excel Time Calculation Tricks
      • Excel Date and Time Formatting
    • Excel Keyboard Shortcuts
    • Excel Custom Number Format Guide
    • Pivot Tables Guide
    • VLOOKUP Guide
    • ALT Codes
    • Excel VBA & Macros
    • Excel User Forms
    • VBA String Functions
  • Members
    • Login
    • Password Reset
  • Blog
  • Excel Webinars
  • Excel Forum
    • Register as Forum Member

Headcount Calculation Measure and Pivot Table Totals|Power Pivot|Excel Forum|My Online Training Hub

You are here: Home / Headcount Calculation Measure and Pivot Table Totals|Power Pivot|Excel Forum|My Online Training Hub
Avatar
sp_LogInOut Log In sp_Registration Register
sp_Search Search
Advanced Search|Last Search Results
Search
Forum Scope


Match


Forum Options


Minimum search word length is 3 characters - maximum search word length is 84 characters
sp_Search Search
sp_RankInfo
Lost password?
sp_CrumbsHome HomeExcel ForumPower PivotHeadcount Calculation Measure and P…
sp_PrintTopic sp_TopicIcon
Headcount Calculation Measure and Pivot Table Totals
Avatar
Mamie Roughgarden
Member
Members
Level 0
Forum Posts: 12
Member Since:
August 23, 2021
sp_UserOfflineSmall Offline
1
August 23, 2021 - 4:52 pm
sp_Permalink sp_Print

Hello everyone! I'm a little bit stuck on a headcount calculation that I need for a client project I'm working on. I've watched the HR dashboard video (which is excellent!) but I can't use the function of "count" on employee IDs because the data coming to me is manually entered by reps in various locations. So instead of a unique identifier for each person, Location A has 250 in January, 265 in February, and 240 in March, for example. The measure that I currently have in place is:

=CALCULATE(SUM(Consolidated_Dashboard_Table_10[Actual Headcount]),FILTER(Consolidated_Dashboard_Table_10,[Formatted Date]=MAX([Formatted Date])))

It seems to work until I filter the data - some of my totals in my pivot table go away and I need help to fix that. Thank you!

sp_AnswersTopicSeeAnswer See Answer
Avatar
Mynda Treacy
Admin
Level 10
Forum Posts: 4449
Member Since:
July 16, 2010
sp_UserOfflineSmall Offline
2
August 24, 2021 - 1:13 pm
sp_Permalink sp_Print

Hi Mamie,

Welcome to our forum! We'd need to see your file or a mockup of your file, or at a minimum, screenshots so we can understand the filter context you're wanting to apply.

Mynda

Avatar
Mamie Roughgarden
Member
Members
Level 0
Forum Posts: 12
Member Since:
August 23, 2021
sp_UserOfflineSmall Offline
3
August 25, 2021 - 1:29 am
sp_Permalink sp_Print

Hi Mynda,

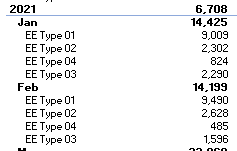
Here is what my Pivot table is looking like with no filters applied:
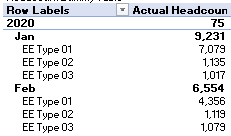
SS01-1.pngImage Enlarger

SS02-1.pngImage Enlarger

When I filter the data, the numbers for the month are there, but the subtotal for the year is gone. I got a little closer when I redid the measure to be the following (the totals are still present) but it's totaling everything instead of just giving me the most recent total based on my filter choices (location, business unit, etc.).

=CALCULATE(SUM(Consolidated_Dashboard_Table_10[Actual Headcount]),FILTER(ALL(Consolidated_Dashboard_Table_10[Formatted Date]),LASTDATE(Consolidated_Dashboard_Table_10[Formatted Date])))

sp_PlupAttachments Attachments
  • sp_PlupImage SS01-1.png (3 KB)
  • sp_PlupImage SS02-1.png (3 KB)
Avatar
Mamie Roughgarden
Member
Members
Level 0
Forum Posts: 12
Member Since:
August 23, 2021
sp_UserOfflineSmall Offline
4
August 25, 2021 - 7:38 am
sp_Permalink sp_Print

Hi Mynda,

Here is my note with more details. 

https://privnote.com/RI5wdC6Y#AlHJTuUxQ

I think the issue is in the FILTER part of my formula, I just can't figure out which part. 

I appreciate your help!

Mamie

Avatar
Mynda Treacy
Admin
Level 10
Forum Posts: 4449
Member Since:
July 16, 2010
sp_UserOfflineSmall Offline
5
August 25, 2021 - 4:31 pm
sp_Permalink sp_Print

Hi Mamie,

I couldn't open the privnote and the screenshots don't tell the story enough for me to help. Please create a dummy/mockup file containing some unsensitive data. It doesn't need to be a lot of data. Just enough to illustrate the issue and represent all possible scenarios.

Thanks,

Mynda

Avatar
Mamie Roughgarden
Member
Members
Level 0
Forum Posts: 12
Member Since:
August 23, 2021
sp_UserOfflineSmall Offline
6
August 26, 2021 - 2:57 am
sp_Permalink sp_Print

Hi Mynda,

Aw that's too bad! Maybe it was user error on my part...

I wasn't sure what the best way to scale down the file without throwing lots of things off so I relabeled everything to be generic. I just tried to load the dummy file I made and it's too big to post here. 🙁

Here is the link to the Dropbox folder if that's helpful: https://www.dropbox.com/sh/sma.....iP0Ha?dl=0

Thanks!

Mamie

Avatar
Mynda Treacy
Admin
Level 10
Forum Posts: 4449
Member Since:
July 16, 2010
sp_UserOfflineSmall Offline
7
August 26, 2021 - 5:29 pm
sp_Permalink sp_Print

Hi Mamie,

Thanks for sharing your file. You can use the implicit measures already built into PivotTables for these calculations. That is, build a PivotTable with the following fields:

Rows:

Formatted Date (grouped by Year and Month)

Employee Type

Values:

Actual Headcount

Budget Approved Headcount

Columns:

Values

Right-click on the month name in the PivotTable > select Subtotal by Month. Repeat for the Years field.

Hope that points you in the right direction.

Mynda

Avatar
Mamie Roughgarden
Member
Members
Level 0
Forum Posts: 12
Member Since:
August 23, 2021
sp_UserOfflineSmall Offline
8
August 27, 2021 - 1:08 am
sp_Permalink sp_Print

Hi Mynda,

Thanks for your reply! I hadn't even thought about using the Formatted Date because I just recently added that.

I get really close with what you outline above, but I'm still stuck on getting the Year total to show me the most recent Month total where the headcount is greater than 0. There are some locations that will not have data for the most recent date in the workbook but I still need to show their most recent headcount. How can I do this? 

I appreciate your help! 🙂

Avatar
Steve Olson
Member
Members

Power Query

Power Pivot

Power BI
Level 0
Forum Posts: 25
Member Since:
October 17, 2018
sp_UserOfflineSmall Offline
9
August 27, 2021 - 2:19 am
sp_Permalink sp_Print

In the Power Pivot course, it was suggested to try to use Explicit Measures rather than Implicit Measures.

Does Mamie's question lend itself more to an Implicit Measure?  If that's the case I'm not quite sure when best to use Explicit vs Implicit Measure.  Is this just based on experience with Power Pivot?


Thanks,


Steve 

Avatar
Mamie Roughgarden
Member
Members
Level 0
Forum Posts: 12
Member Since:
August 23, 2021
sp_UserOfflineSmall Offline
10
August 27, 2021 - 5:26 am
sp_Permalink sp_Print

Hi Mynda,

I went back to your HR Dashboard video and I seem to have gotten this to work by writing another measure based on what you wrote for separations in the HR Dashboard video as follows:

=CALCULATE([Actual Headcount Calc],FILTER(Consolidated_Dashboard_Table_10,NOT(ISBLANK([Actual Headcount Calc]))))

This is now giving me the most recent month total as a subtotal for the year even if the max date in the table has no data. For example, the most recent date in my file is July 2021 but my biggest location problem child didn't have any data for July - their most recent data was June. Now the June total is showing in the 2021 subtotal instead of a blank (or 0), which is exactly what I wanted. 🙂 🙂 I'm so happy right now!

sp_AnswersTopicAnswer
Answers Post
Avatar
Mynda Treacy
Admin
Level 10
Forum Posts: 4449
Member Since:
July 16, 2010
sp_UserOfflineSmall Offline
11
August 28, 2021 - 10:25 pm
sp_Permalink sp_Print

@Mamie, I see. I misunderstood your question. Glad you got it working.

@Steve, explicit measures are ideal when you need to write further DAX measures based on what would normally be an implicit measure e.g. something basic like a SUM or COUNT etc. But when you only need something basic like a SUM or COUNT, which it what I thought Mamie needed, then there's no need to over engineer it with explicit measures. Hope that makes sense.

sp_Feed
Go to top
Forum Timezone: Australia/Brisbane
Most Users Ever Online: 245
Currently Online: Kim Knox
Guest(s) 9
Currently Browsing this Page:
1 Guest(s)
Top Posters:
SunnyKow: 1432
Anders Sehlstedt: 871
Purfleet: 412
Frans Visser: 346
David_Ng: 306
lea cohen: 219
Jessica Stewart: 204
A.Maurizio: 202
Aye Mu: 201
jaryszek: 183
Newest Members:
Bhuwan Devkota
Kathryn Patton
Maria Conatser
Jefferson Granemann
Glen Coulthard
Nikki Fox
Rachele Dickie
Raj Mattoo
Mark Luke
terimeri dooriyan
Forum Stats:
Groups: 3
Forums: 24
Topics: 6221
Posts: 27285


Member Stats:
Guest Posters: 49
Members: 31909
Moderators: 3
Admins: 4
Administrators: Mynda Treacy, Philip Treacy, Catalin Bombea, FT
Moderators: MOTH Support, Velouria, Riny van Eekelen
© Simple:Press —sp_Information

Sidebar

Blog Categories

  • Excel
  • Excel Charts
  • Excel Dashboard
  • Excel Formulas
  • Excel PivotTables
  • Excel Shortcuts
  • Excel VBA
  • General Tips
  • Online Training
  • Outlook
  • Power Apps
  • Power Automate
  • Power BI
  • Power Pivot
  • Power Query
microsoft mvp logo
trustpilot excellent rating
Secured by Sucuri Badge
MyOnlineTrainingHub on YouTube Mynda Treacy on Linked In Mynda Treacy on Instagram Mynda Treacy on Twitter Mynda Treacy on Pinterest MyOnlineTrainingHub on Facebook
 

Company

  • About My Online Training Hub
  • Disclosure Statement
  • Frequently Asked Questions
  • Guarantee
  • Privacy Policy
  • Terms & Conditions
  • Testimonials
  • Become an Affiliate

Support

  • Contact
  • Forum
  • Helpdesk - For Technical Issues

Copyright © 2023 · My Online Training Hub · All Rights Reserved. Microsoft and the Microsoft Office logo are trademarks or registered trademarks of Microsoft Corporation in the United States and/or other countries. Product names, logos, brands, and other trademarks featured or referred to within this website are the property of their respective trademark holders.