Hello All
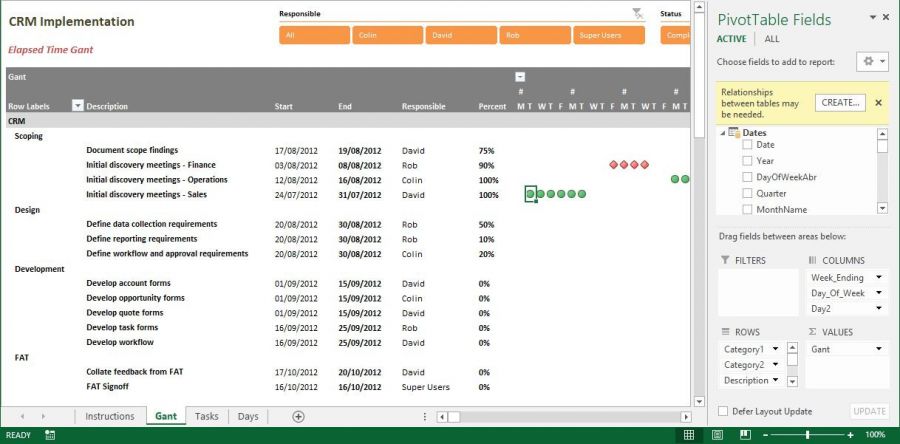
I'm trying to develop a PT to display a Gantt chart. I found this article on powerpivotpro which features this Gantt:

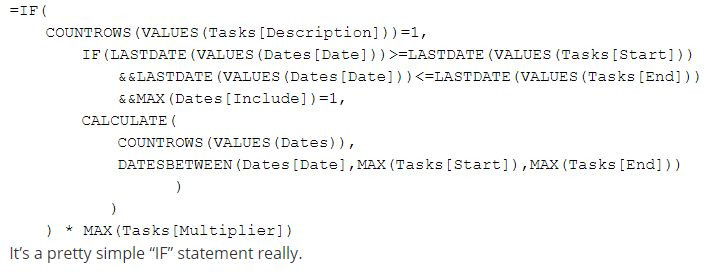
So I downloaded the workbook and figured I could use this as a basis for my chart. Now, I'm the first to admit that my understanding of pivot tables is basic, though it's in different league compared with my understanding of DAX. Nevertheless, where there's a will there's a way (or so I naively thought). So I set about trying to adapt this measure formula:

Note the comment below the code! (but this isn't a question about DAX - please read on.)
I've no need for the "multiplier" or the "Include" - I'll be happy if the measure simply produces a series of "1"s to which I can then apply conditional formatting. Anyway, after much trial and many errors, I managed to produce this

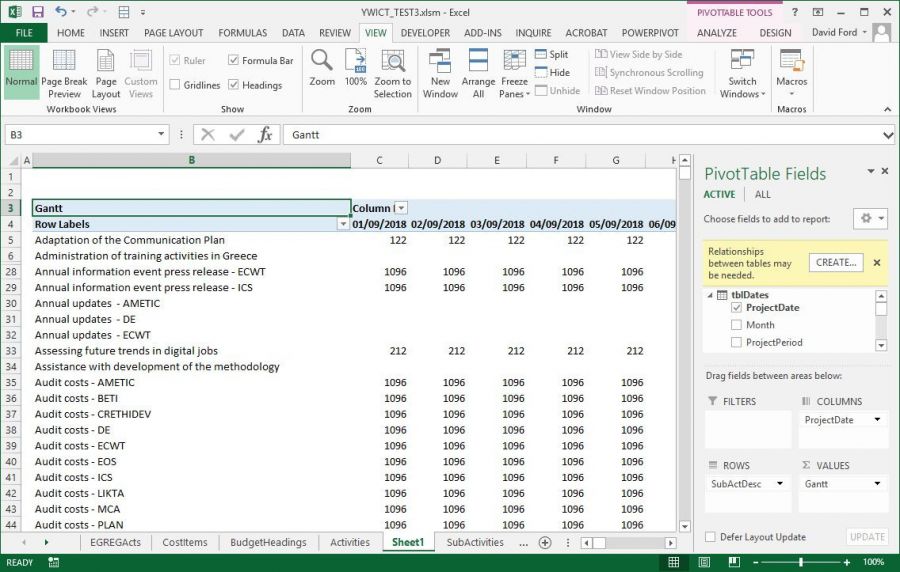
When I dropped the Gantt measure on to my simple pivot table:

Instead of displaying "1" under each day for each activity, it displays the total number of days between PlanStart and PlanFinish. Note that the under COLUMNS I only have ProjectDate, which comes from my Dates table.
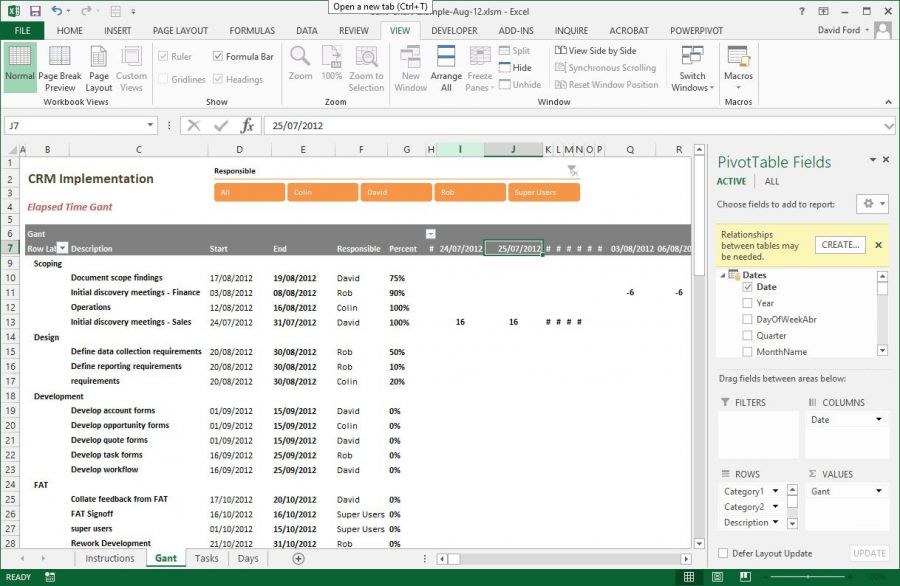
After spending a whole day changing the Gantt measure formula, in an attempt to make it display "1"s, I gave up and took another look at the original Gantt pivot table. I removed the Week_Ending, Day_Of_Week and Day2 from COLUMNS and replaced it with Date:

This now displays the number of elapsed days between Start and Finish (though the number is modified by the Multiplier so that, for example, the 8 days between 24/07/2012 and 31/07/2012 becomes 16.
So my "error" was nothing to do with the Gantt measure, it's something to do with the columns in the PT.
I just can't get my head around this - can anyone help me out in understanding what's happening here, before I lose the little hair that i have left?
In desperation,
David
PS. None of the questions in the last few years to the original post on powerpivotpro have been answered; that's why I'm not asking on there.
Hi David,
Are you able to share your Excel file? You can anonymize the data if it's sensitive.
Mynda
Hi Mynda
Thanks for the response.
Workbook is too large to attach; you should be able to access it using this link. The sheet with the Gantt chart is, imaginatively, named Gantt and the measure is in table tblsubactivities in the PP model.
This workbook contains the model as it was when I wrote the original post. Since then I've changed the structure, though the problem I described is still there.
Regards
Looking forward to your words of wisdom!
David
David
Hi David,
I'm unable to open the file from that link. It tries to open in Excel Online, then says the file is too big and offers me the option to open in Excel on the Desktop, but it doesn't work!
Are you able to give me a download link either from OneDrive or DropBox or WeTransfer or similar?
Mynda
Hi Mynda
Sorry for the problems with the OneDrive file.
I've sent a WeTransfer message to website at myonlinetraininghub.com
Thanks again, and sorry for wasting your time.
David
Hi David,
You can change your formula to the one below if you just want a 1 to show up where there is activity on a particular date:
=IF(
    COUNTROWS(VALUES(tblSubActivities[SubActCodeDesc]))=1,
          IF(LASTDATE(VALUES(tblDates[ProjectDate]))>=LASTDATE(VALUES(tblSubActivities[PlanStart]))
          &&LASTDATE(VALUES(tblDates[ProjectDate]))<=LASTDATE(VALUES(tblSubActivities[PlanFinish])),
   CALCULATE(1,
          DATESBETWEEN(tblDates[ProjectDate],MAX(tblSubActivities[PlanStart]),MAX(tblSubActivities[PlanFinish])))))
Mynda
Hi Mynda
Thanks - works a treat!
So, was the original method over-complicating things unnecessarily?
And, if I may, one last question. My workbook contains a fair number of sheets but, in the scheme of things, not that much data. Is there something "wrong" with my model, or should I expect such an amount of data to lead to a 6 MB file?
Thanks again!
David
The original method allowed for different markers for overdue, complete etc. which you didn't need.
Things that can make a workbook large:
- Formulas in tables. Where you don't need to maintain the formulas, copy and paste them as values.
- I notice you have a Dates table calculated in Excel. It is more efficient to do this in Power Query and then load straight to Power Pivot, thus removing the formulas and the duplicated data in the worksheet.
- Power Pivot is good at compressing columns of data where there are many of the same values, but where there are a lot of unique values then compression is limited. e.g. it will be good at compressing the tblDates because only the first column contains unique values, but the CostItems table won't compress as well because there will be few columns with a lot of duplicates.
- Keep in mind that your data is in the file twice, once in the Tables in the worksheets and again in the Power Pivot model. If your data comes from another system then consider using Power Query to get it and put it in Power Pivot. You could even leave the data in one Excel file and connect to it from another file that only contains your data model and analysis.
I hope that gives you some ideas.
Mynda
Thanks Mynda - much appreciated!
