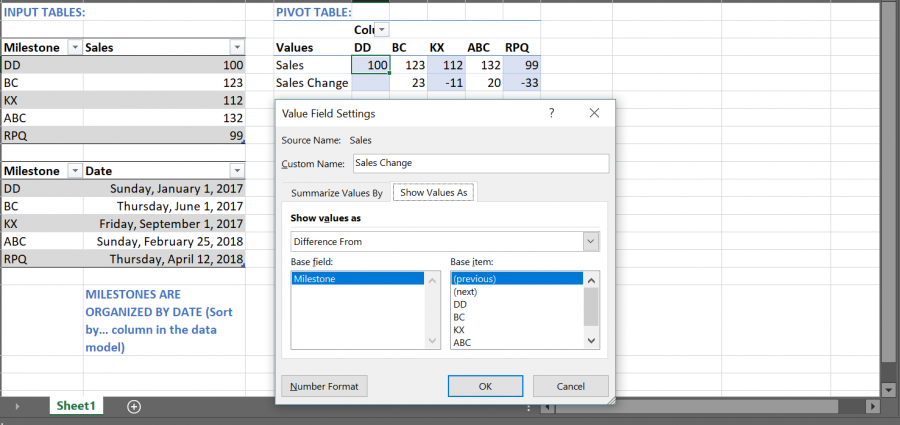
I'm trying to re-create the Difference from previous field pivot table behavior in a Power BI matrix.

The columns are milestones, organized by date (but not regular intervals).
I'm looking for a way to create a measure that reciprocates the Sales Change behavior from the pivot table and preferably works even if not all milestones are displayed. I tried several ways to create a dynamic rank but I cannot figure out how to use that to calculate the difference from the previous item.
Any help is appreciated. I have attached the Excel and PowerBI file as a reference.
Thank you!
Hi Rita,
Usually you'd use dates and time intelligence functions for this, but you don't have a date table, so you can add an index column to the Sales table as a reference for the previous milestone. See file attached. Solution based on this.
Mynda
Hi Mynda,
Thank you for sharing!
1. Currently, I have a similar solution implemented (based on MAX in the index column) but that - and your proposed solution as well - only works if all milestones are selected.
2. I can add a date table if that solves the problem. But the periods between the milestones are irregular. Could I still use time intelligence functions?
Thank you!
Rita
Hi Mynda,
I managed to figure it out with a slight tweaking of the variable you provided.
Change Sales = [Typical sales]-
VAR
previousP = CALCULATE(
MAX(Table[Index]),
FILTER(ALLSELECTED(Table),
Table[Index]<MAX(Table[Index])))
RETURN
CALCULATE([Typical sales],
FILTER(
ALLEXCEPT(Table, Table[Slicer]),
Table[Index]=previousP))
Thanks again!
Hi Rita,
Indeed, the key is ALLSELECTED. First, calculate the previous row index, based on selected data:
Hi Catalin,
Thank you!
Good point about the Grand Total! In our scenario, this measure is never shown with a grand total (it doesn't make any sense to aggregate up the changes) but I can imagine other scenarios where it's important.
I use this measure in Power BI (and not Power Pivot in Excel) and the data model is a lot more complicated with various slicers and filters being applied so it took quite some time to figure out the right combination of ALL(), ALLSELECTED() and ALLEXCEPT() and the filter directions to make it work.
Thank you both for your support!
