Hello,
I have some data that shows percentage gains by date and I'd like to summarize it in a pivot table to show compounded gains by month.
I've tried adding a calculated field using the formula PRODUCT( 1+ "field name") -1 but this gives the same value as summing the values.
Does anyone know if it's possible to do this within a pivot table?
Could you upload an example file? Than we don't have to guess and create something from scratch.
Here's a table with some dates over 3 months with some percentages.
The right hand column in the table shows the compounded total at the end of each month using the formulas PRODUCT (1+B2:B21)-1 , PRODUCT (1+B2:B21)-1 and PRODUCT (1+B2:B21)-1
The 2nd column in the pivot table is a calculated field attempting to use the same formula but unfortunately it gives the same result as summing the percentages in column 1
See attached. You can't do that with a regular pivot table. You need Power Pivot / Data Model (DM).
I created a few extra columns in the DM and some measures that achieve what you asked for. I believe you want the Month-to-date Compounded %, though I also included a Year-to-date calculation.
Thank you Riny,
That looks just what I'm after.
I've not used power pivot or the data model before.
The actual data I am going to analyse will be imported from a folder via power query.
Do I put the data straight into the data model at that point, what are the steps?
Also, if I wanted to compound an actual amount say from 100 using these percentages, I assume that would follow a similar process?
I will go through Mynda's videos on power pivot and data model but if you have any advice re this it would be greatly appreciated.
When you are done with PQ you can indeed load the table directly into the DM. No need to load it to an Excel table. Just check the box "Add this data to the Data Model"

I see no problems using these compounded percentages in further calculations. But come back here in case you get stuck.
Hello Riny,
I've tried to copy your example (see attached) and it went ok until I got to the compounded%YTD measure.
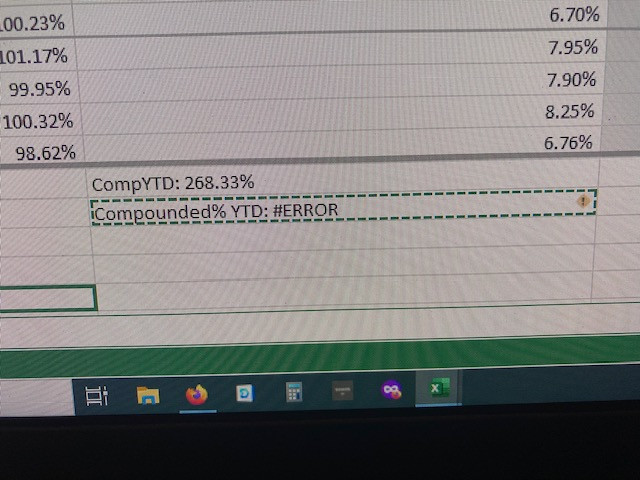
This produces an error and stops me from building a pivot table.
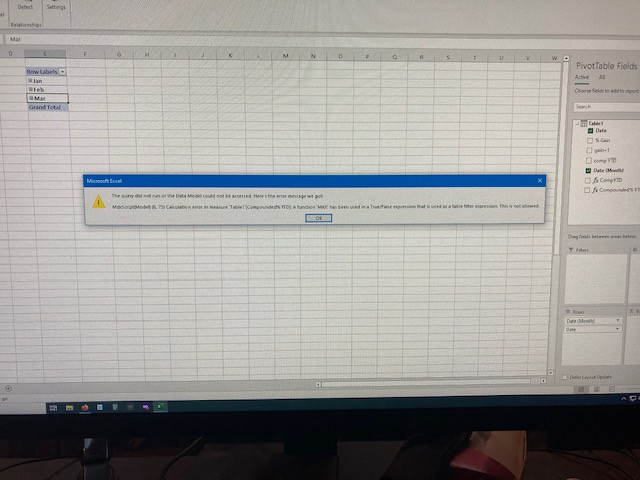
I get an error message saying I can't use the MAX function within the filter of the CALCULATE function.
I've noticed that there is also an error with your compounded%YTD measure and yet you were able to build a pivot table.
Any ideas?
Looked at your file and get no errors. The Compounded% YTD measure works as expected. Can up upload a screenshot of the error? What Excel version are you using?
Here are some photos of my screen. I couldn't get screenshot to work in excel for some reason.
The first is the pivot table error message. After clicking ok, I get the error icons in the fields list. The third photo is the data model screen.


I'm using microsoft 365. Are there any settings I should have enabled?
I found a post from 2019 on this very error message.
The solution provided there is to wrap the true/false bit in the FILTER function. Added such a measure to the model. Does it work on your side as well? If so, you are perhaps not using the latest version of Excel.
Thank you again,
The FILTER solution worked.
However, I've ran an update but your original solution still produces an error.
It's a bit baffling, I guess I could try an uninstall/ re-install.
Otherwise, I'll have to try contacting Microsoft which might prove to be a painfull endeavour!
Glad it worked. Can't tell why my original solution doesn't work for you. Sorry!
Which release channel are you on? If it's something like semi-annual enterprise, it's probably just a feature difference.
I'm on current channel so I guess I should be up to date.
I shall try doing an uninstall/reinstall over the weekend, see if that solves it.
Hello again,
I'm now practicing with some data over 3 years.
The formulas, as they are, work properly on the first year of data but give the wrong results in the following years.
I'm assuming ths is because I need to filter by years. I've had a go at changing the formulas to add a year filter but I keep getting syntax errors.
I'm new to DAX and although I've watched a few videos on CALCULATE, FILTER and EARLIER, I'm not really sure what's going on.
Could you give a brief explanation of the Comp YTD and Comp MTD column formulas and what needs to be changed to give correct results for all years,
Thanks
