I loaded data into Power BI and then did some transformations in query. When I click 'load and apply' the new columns show up in the table, but not the calculations. Any idea what I am doing wrong?
Hi Moriel,
I'm not sure what you mean by 'the calculations'? Are you saying in Power Query you can see results in the new columns, but when you close & apply you see blanks/zeros in these new columns?
I can't edit your queries because they reference files I don't have, so it's difficult to see what you're referring to. Perhaps you can share screenshots of what you see in PQ and then what you see in PBI.
Mynda
Thanks Mynda-
yes exactly what my issue is. In query I see values in the new columns, but not in the Power BI tables/model
Hi Moriel,
As I mentioned, I can't open your queries and you haven't said which columns you've added, but if I look at the tables in Power BI and select any of the numeric column filter buttons, you can see there are values greater than or less than zero. However, the first pages are all zero. Have you checked there are values by looking in the filter drop downs for the new columns?
Mynda
Firstly thank you for your patience.
Second, I'm attaching 2 screen shots. 1 is Power BI in the table view and you can see the census and average rate colums are blank and there is nothing there for me to filter by. The second is if I switch to "transform data" in query view- the information is all there. I click "load and apply", but nothing updates.
Thanks for the screenshots. The data types for those columns are not set in Power Query. Both are type 'Any'. If you set the data types, do they then appear correctly in Power BI?
still doesn't show.
What can I upload to help you help me?
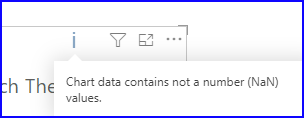
When I open your pbix file and look at the "anncillary_expenses" table, I note that the last column is full of "NaN" (not a number). The visual itself also displayed an information icon in the top-left corner, indicating that there is a problem (see screenshot).

This results from the applied step where you calculate Ancillary PPD in Power Query, where [census] equals 0 (i.e. zero). You can compare this with a #DIV0! error in Excel.
Try by changing this:
#"Inserted Division" = Table.AddColumn(#"Changed Type1", "Ancillary PPD", each [Total Expenses] / [census], Currency.Type),
to this:
#"Inserted Division" = Table.AddColumn(#"Changed Type1", "Ancillary PPD", each if [census] = 0 then null else [Total Expenses] / [census], Currency.Type),
Alternatively, leave PQ as it is but filter the visual in the pbix file for: census is not 0
Then a clustered column chart will be displayed.
I've done that in the attached file as I couldn't amend the query for reasons explained by Mynda.
Thank you,
I tried but it's still not displaying properly and neither is my data. I tried to update the query itself before Power BI and it still doesn't help. I did filter out the 0 so as not to generate that errors. Attached is the query file with limited data. Does that help?
Here is the original Power BI file
Thanks! I can now link the pbix file to its xlsx source. but there's not much going on in the pbix file. It contains a report with three visuals. Is something wrong in the report? If so, can you explain?
Looking at the xlsx file, this is where all the action seems to be. Unfortunately, this one connects to files from a folder on your system. So, again I cannot really follow what's going on. It's difficult to do that from looking at the M-code alone. So, I'm wondering, which "query transformations" are "not showing" in which tables?
Thank you and Mynda for your patience. I re-read what you wrote, and went back to review what I did and reboot my machine. For whatever reason Power BI wasn't properly "updating/refreshing". Now my visuals reflect the correct data. One separate question, the visual named average rate by payor. See two screen shots. I'm interested in trending the avg rate data but the visual seems to be reflecting something totally different. Not the average or the total. I'm sure I have something wrong selected, but cant figure out what.
