Hi,
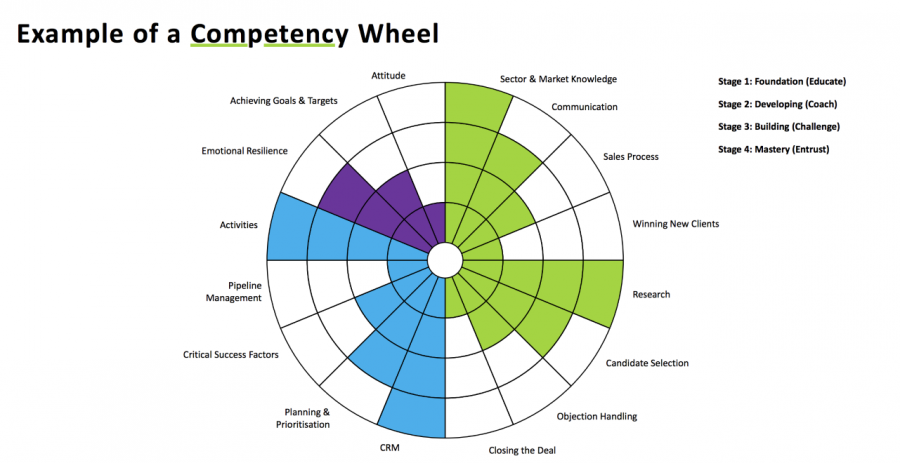
I have been asked to create a chart that shows a persons achievements against certain goals. An example of what I am after is attached.
I have had a look and I thought initially it was a sunburst chart. However I have played around with this and I can't get it right. I don't seem to be able to get it to display the full circle with all of the options and fill the ones that have been achieved.
Any ideas as always gratefully received.
Thanks
Bax
Hi Bax,
Can you please upload a sample Excel file with your data?
Thanks,
Mynda
Hi Mynda,
I wasn't given any data just the image of the chart that I attached to my last post. I was told that it was done in Excel and asked if I could re-create it.
I have had a go using a sunburst chart. The attached file shows how far I got. It is sort of right but it doesn't show the full circle layout with the levels achieved completed like the one in the image file.
The idea of the chart is to show an individuals progress against 16 categories. The categories are shown as the segments (spokes?) of the wheel. The achievement against each category has 4 levels, Stage 1 - foundation, Stage 2 - Developing, Stage 3 - Building, Stage 4 - Mastery. As a level is achieved by the individual the segment is filled with a colour starting at the centre as Stage 1 moving out to the perimeter as Stage 4.
Regards
Bax
Hi Bax,
My guess is that this is a doughnut chart (like in your sheet2) that has manually had the fill colour removed for each blank segment, as there's no way to force the sunburst chart to put borders on the segments. You'll also have to manually label the doughnut chart segments because the labels for doughnut charts are on the inside.
Mynda
Hi Mynda,
Thanks for pointing me in the right direction. I have managed to create the chart as required (see attached).
It was a bit fiddly to do but works fine. The workings can be seen starting in column D, they are hidden behind the chart.
The stage achieved for each category can be updated by entering a value from 0 to 4 in column B.
Hope this helps someone else.
Thanks
Bax
Great to see you got it working! Thanks for sharing 🙂
