Notifications
Clear all
Dashboards & Charts
2
Posts
2
Users
0
Reactions
999
Views
Topic starter
Hi All,
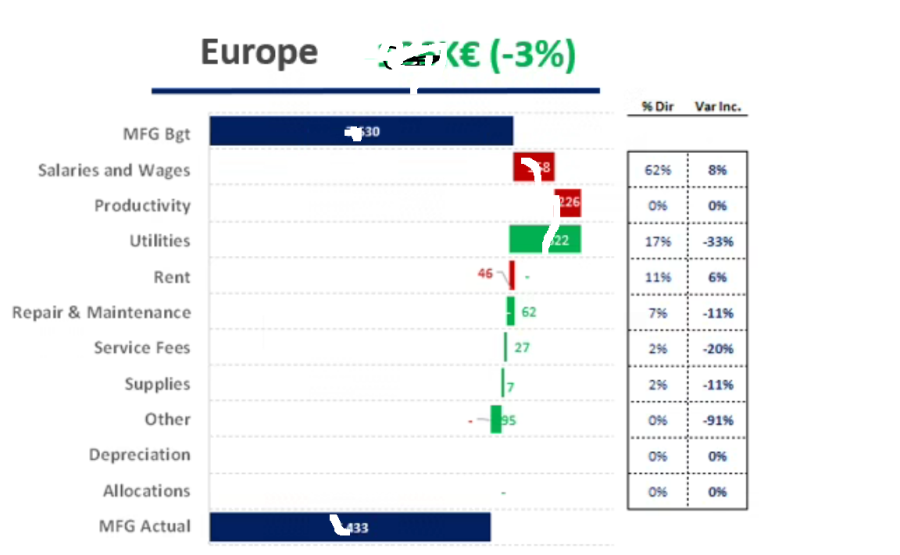
I need to make a waterfall chart with vertical axis like below example but it seems like it is not possible to make in Power BI?

2. I need to keep the same order for breakdown types instead of ordering from variances. I see in the visual it is not possible to sort by breakdown so even if I had a sort table for breakdown, it does work?
Thanks!
Posted : 28/04/2023 5:09 am
In Excel we would use a stacked bar chart for this and set the fill colour for the dummy series below Salaries etc. to 'no fill'. Not sure if you could do something similar with Power BI.
Posted : 28/04/2023 7:30 pm
