Hello everyone,
I am looking for a way to accumulate the quantity (QTY) for a specific item (commodity) in Excel and Power BI. I would like the running total to reset and display as a new subtotal whenever a new date occurs, creating a new row for the subtotal. Additionally, I need this process to be automated so that the running total updates and reflects in the PowerBI dashboard automatically whenever the Excel sheet is edited or updated.
Furthermore, in the PowerBI dashboard, I want the clustered columns divided by the commodities to show the accumulation on every new date.
Any assistance or guidance on how to achieve this functionality would be greatly appreciated. Thank you in advance for your help!
Hello Akram,
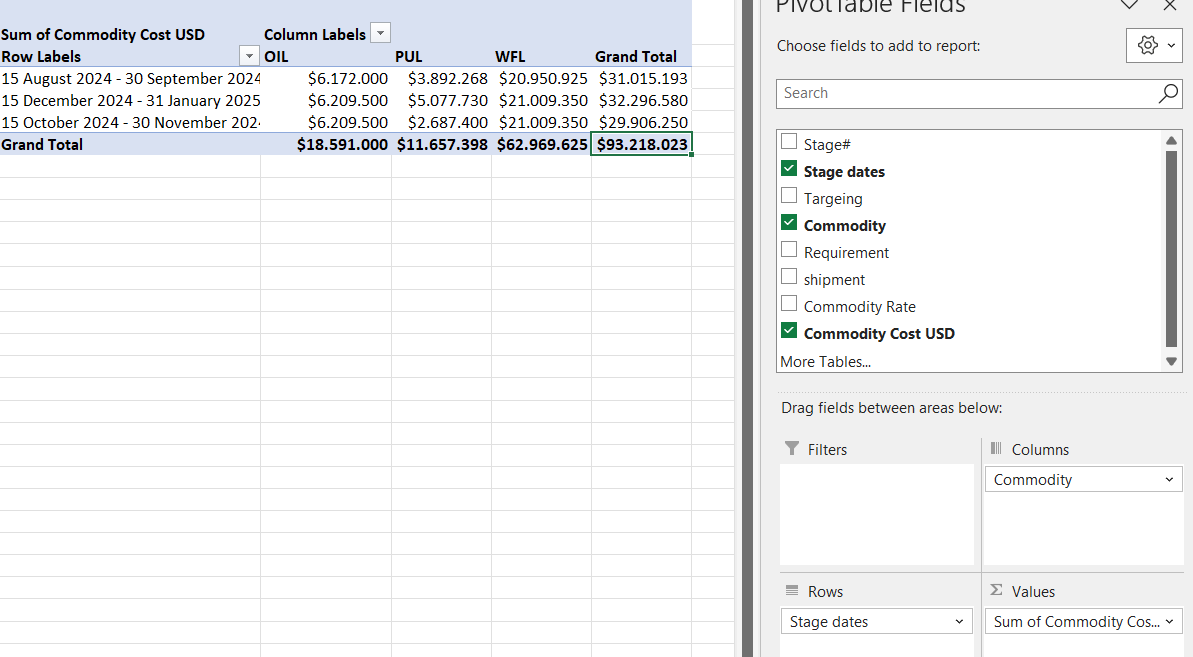
I would solve your problem by using a pivot table.
1) You need to normalize your data:
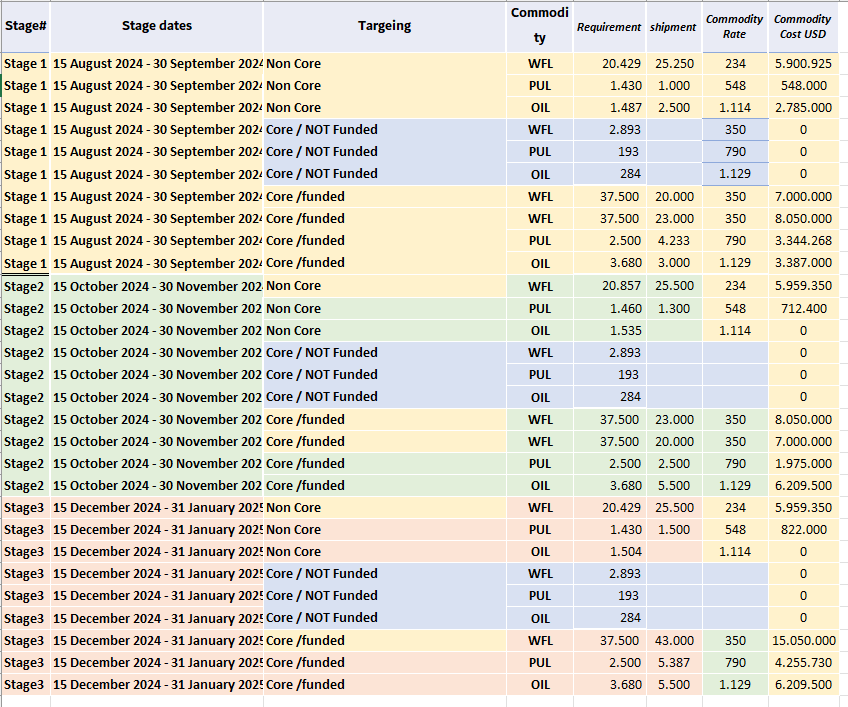
2) you use this range as a data range for a pivot table and use
Stage dates as Rows,
Commodity as Columns and
Commodity cost USD as Values:
Good luck,
BartH
Thank you BartH for your assistance and for the pivot table suggestion—it’s very helpful!
I would like to highlight an additional thing: I need the accumulated shipment quantity to appear after each new date, even if there is no new quantity added. This is crucial for me to ensure that it reflects accurately on the clustered columns in Power BI.
Thanks again for your support.