Hi,
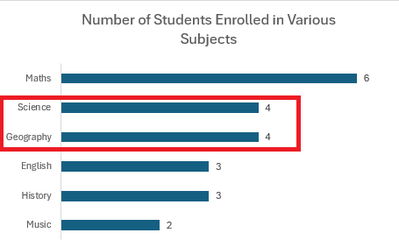
How to arrange top 5 horizontal bar charts by: (1) values in descending order (2) for those with same values, to arrange in alphabetical order. In the attached file, Science and Geography have the same value. How to display the chart for Geography to be above Science? The excel file is shared via this link:
Thank you.
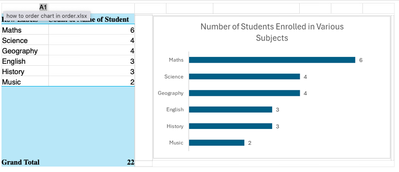
I could not get into you file without asking permissions. You should be able to upload it with your message to the forum also. Anyhow, this is what I see:
You reversed the order of the Categories on the axis as a bar chart would display them bottom-up by default. Your chart displays the labels in the order of the data as shown in the picture. So, move the Geography data above the Science data and the chart will display as you want it to.
If the data is custom sorted automatically (e.g. first by value largest to smallest then by category A-Z) , it could be that the unrounded value for Science is slightly greater than the one for Geography, although they both display the value of 4. Use the ROUND function to round all values to 0 decimals in case you want to work with whole numbers.
Attaching my file with an example based on yours.
Hi, I am not able to manually move the rows up or down as the file that I am working on has more than 500,000 rows.
There is no rounding issue here as it is simple counting of students taking a particular subject.
Thank you.
Sorry! I was confused. I now could download the file without logging in. See attached.
I first manually correct the order of Subjects A-Z by dragging Geography above Science. That resets the ordering based on Count so then you need to redo the sort the Count of Students largest to smallest. Seems like a bug. Can't explain it otherwise.


