When you deal with elapsed time in Power Query you can make use of the Duration data type. Howevere when you load this into the Data model in either Power Pivot or Power BI, these durations are converted to decimal values.
This post looks at how to use DAX to convert these decimals into human readable text strings showing days, hours and minutes.
Update : Include Seconds in Time Conversion
I've updated the code to include seconds in the conversion.
To get this updated code download this PBIX file.
Watch the Video

Download Power BI Desktop Files
Enter your email address below to download the sample file.
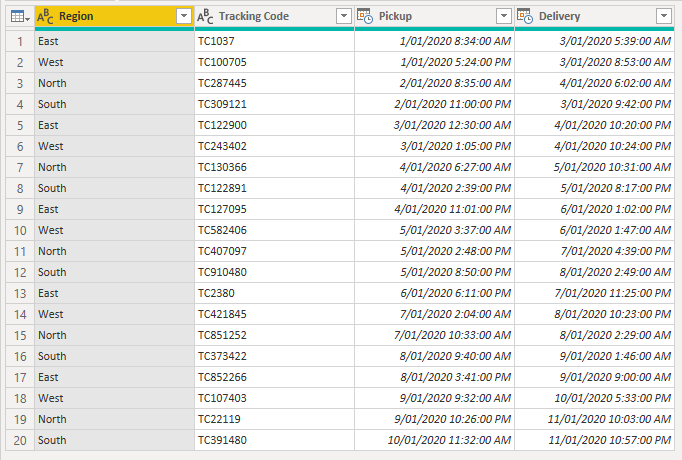
Let's pretend I'm running a delivery company and I track how long each delivery takes by logging the date and time of every pickup and drop off.
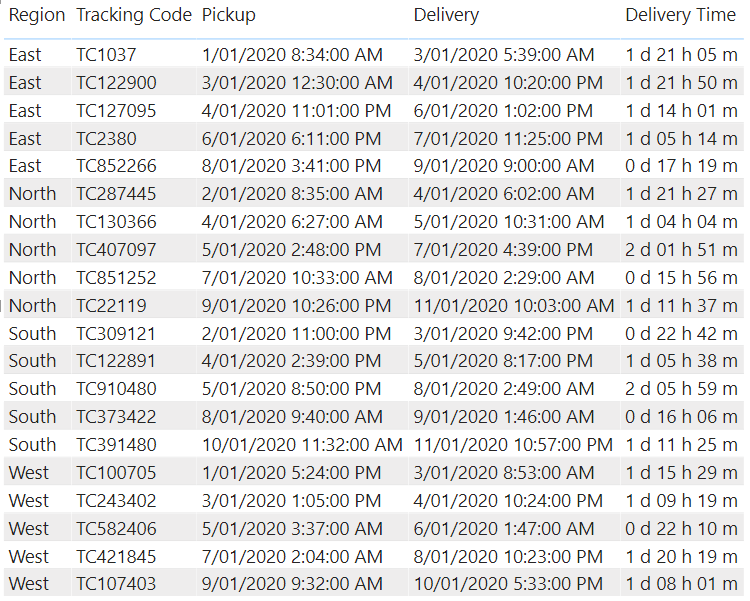
Here's what my data set looks like
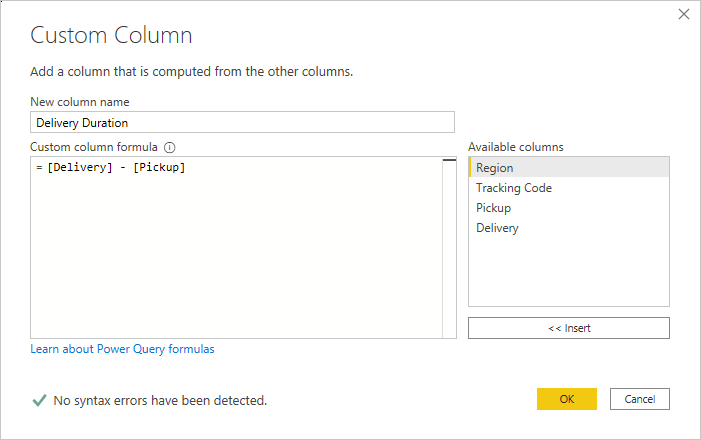
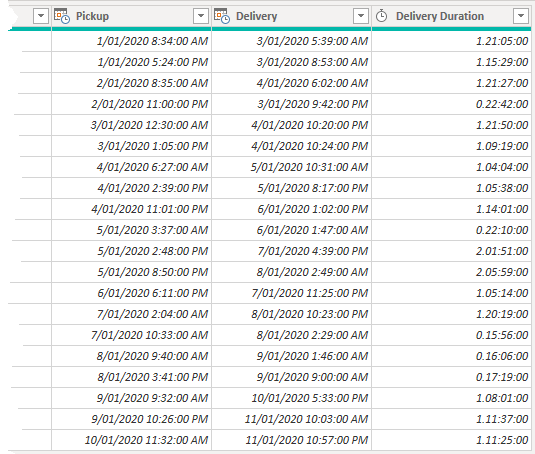
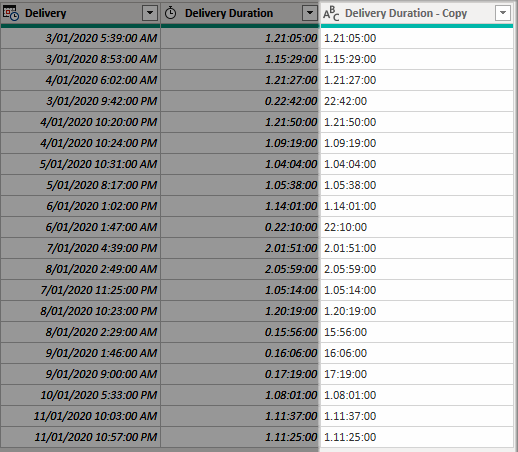
I can add a Custom Column to calculate how long a delivery took by Subtracting the Delivery DateTime from the Pickup DateTime, and I get a nicely formatted durations showing the days, hours, minutes and seconds.
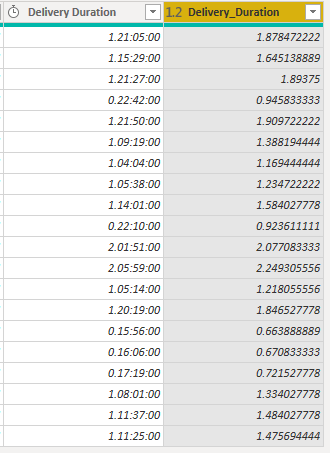
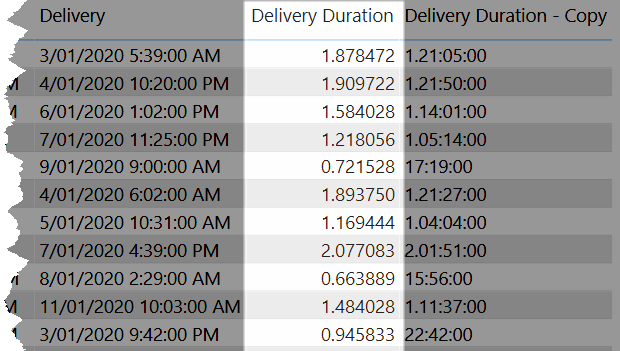
These values are actually stored as decimals as you'll see when I load the data into Power BI's Data Model. The whole part being days and the decimal part being fractions of days.
Storing durations as decimal numbers means that calculations can be done with the values but it makes it very hard for someone to understand exactly how much time has passed.
To make it easy to understand this, the decimal number needs to be displayed in a human readable format.
To do this I'll write a measure in DAX that does the conversion from decimal and then creates a string showing time in Days, Hours and Minutes.
Before I Close & Apply to load the data into the Data Model, I'm going to duplicate this Duration column and set it as Text.
I'm doing this just so I have a reference to the correct duration in DHM format and I can make sure my DAX code is converting the durations correctly.
Clicking Close & Apply closes the Power Query editor and loads the data into the Data Model.
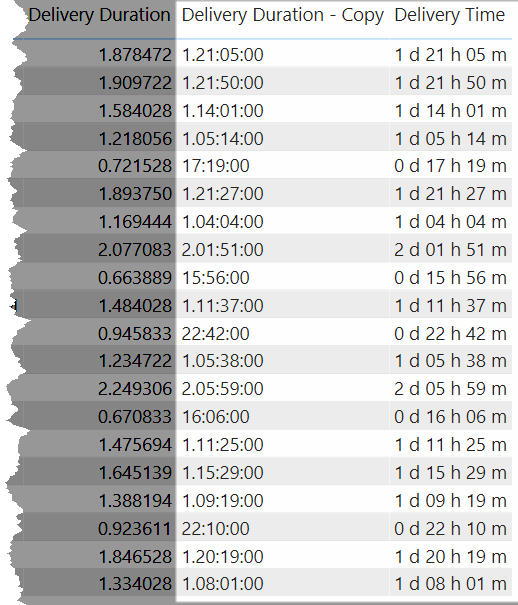
In PBI Desktop I've created a table visual showing the data. You can see the Delivery Duration is a decimal.
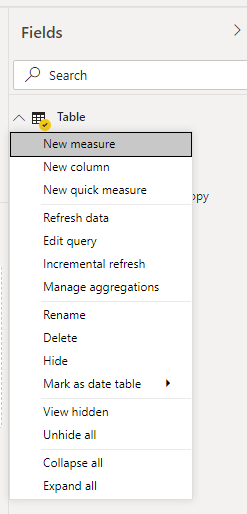
To create a new measure right click on the Table (in the Fields pane) and choose new measure.
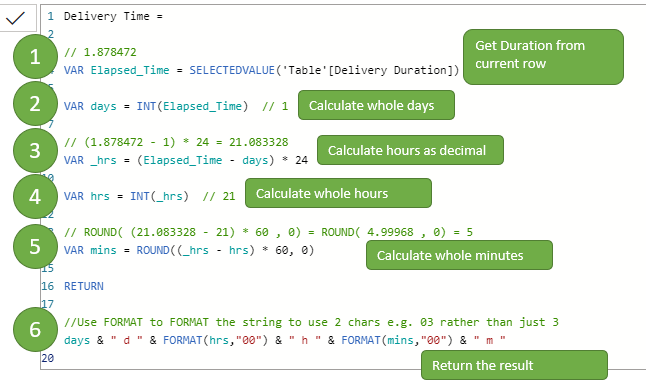
I'm calling this measure Delivery Time. Here's the entire code which I'll go through section by section.
Let's use the first row value of 1.878472 to explain how this code works.
The measure uses several variables that store the different parts of the time.
Rounding to 0 decimal places results in a value of 5 minutes.
You can see that checking against the Delivery Duration text column my measure gets the same answers that Power Query did so I am confident that my code is working correctly.
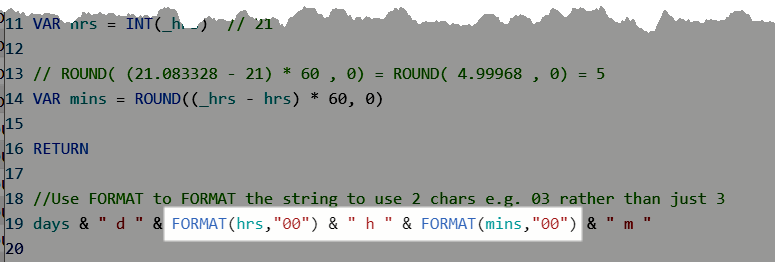
Just one more thing - Using the FORMAT function here allows me to insert leading zeroes as needed so I get 05 rather than just 5 minutes.
If I don't use FORMAT on both the hours and minutes the values in the column don't align, like this.
With the measure written I can now remove the decimal duration column and the text duration column from the table visual.
The decimal duration column still exists in the data table and is still needed for other calculations or to create visuals - so don't delete it.
But I can use my nicely formatted text durations in place of it in visuals like this.



Why would you post a tutorial on writing code and include the code as a screenshot, not a text that can be copied? Like, all the work you put into this, yet you deliberately make it frustrating for people to make use of your article.
I just don’t understand how some people think when they work.
Hi Jim,
You can download the pbi file with the code from the download link provided in the tutorial.
Cheers,
Catalin
I was so hopeful that the suggested measure will work for me but sadly the duration did not show correctly. I have viewing minutes that I want to convert to a duration with a total in Power BI.
Does the measure have to be adapted for this as I think your decimal was days?
Any advice would be so appreciated as I have been battling with this for a couple of days.
Hi Lisa,
My code converts decimal time, with base units of days, to d:h:m:s
If you have a figure in minutes and want to convert that to a duration, you don’t need this measure. You can do that directly in Power Query.
If you are still having trouble please post your question on our forum and attach your file containing your data.
Regards
Phil
Hi
I have a TEXT column with duration format of HH:MM:SS.nn. I want to get the monthly averagex of this column. I can use a slicer to filter the month. I have converted this column to seconds using PATHITEM but again when i do averageX and display it using Gauge then it shows as whole number. Hope you can help me
Hi Richard,
Please post this on our forum and attach your file so we can work with your data.
Regards
Phil
Hi Phil,
thanks for the detailed instructions on how to display durations longer than 24 hours.
What is bothering me now – the result we have here is a text value. We can’t visualise it on a graph.
Could you advise how to convert duration in decimal format to something that would allow me to create visualisation in hh:mm format?
Best regards
Michael
No worries Michael.
You can use the Duration.TotalHours function to convert the Duration from days to hours. You could then plot that value.
Have a look at my example in this PBIX file
If that’s not quite what you are after, please post on our forum with some sample data.
Regards
Phil
Well done. Thanks for the amazingly useful starting point!!
You’re welcome.
Hi Mynda,
but how can we sum the duration ??? For Example: I need the TOTAL (sum) of hours like :
TOTAL = 75:45 (75 hours and 45 Minutes) . I hope you can help !!!!
Kindly Regards
Melih
Hi Melih,
One way would be to SUM the Delivery Duration column using Power Query.
1. Select the column
2. Transform tab -> Statistics -> Sum
Close and Apply then pass the sum you just created into the DAX to create your formatted total duration.
Regards
Phil
Hi Melih,
Thank you for this. It works brilliantly.
I have tried to follow your advice summarising the duration using a power query, but it does not allow me to select Sum (Transform tab -> Statistics -> Sum).
Any advice on how I can achieve this?
Regards
Otto
Hi Otto,
What’s the data type of that column? If it’s numeric it should allow you to sum the values. Does the column header have the text icon : ABC?
Regards
Phil
Please what if I want to use the same way but in years and months, as My inputs are decimals numbers.
for example
John wallas – 4.61 (as service years)
I want to change this decimal to readable context like :
4 year and 7 months
do I have to use the same code??
Hi Bandar,
The code provided converts Decimal Time to Days, Hours, Minutes, Seconds.
You will have to adjust it to work for years and months instead of days and hours, you just have to edit the formula to transform into years and months. The value divided by 365 will give you 2.48 for example. (=2 years, take integer only)
The remainder of 0.48, multiplied by 12 (month) will be 5.76, take also the integer = 5 months
Thanks, this worked great. I’m using it in Power BI, but also in Excel though with a small change as SELECTEDVALUE does not work in Excel. I replaced it with VALUE or SELECT or something, I don’t have the file open and with me, but as with many things in Excel and Power BI, there are many ways to achieve the same result.
Great Shaun, glad you managed to adapt it for your needs.
Thank you! This worked. Now to figure out how to convert the decimal in a Card view to Average Duration with DD:HH:MM:SS formatting.
Hi,
Average duration will be total duration divided by number of data points. The question is what average are you looking for? Total for everything? Just for a particular region? Over a particular time period?
Regards
Phil
Hi Phil,
I was looking to get the Average duration for a particular region or team. I’m stuck on how to make that possible, any suggestions?
Thank you,
Bethany
Hi Bethany,
Does not sound like a complex problem, have you tried this? https://docs.microsoft.com/en-us/power-bi/transform-model/desktop-quick-measures
If you still have problems, you can use our forum to upload a sample file and describe the problem in detail.
Regards,
Catalin
Anon, were you able to find a solution for this? The above solution is text so it is not able to take the averages.
Hi Neha,
As I said to Anon : Average duration will be total duration divided by number of data points. The question is what average are you looking for? Total for everything? Just for a particular region? Over a particular time period?
Need more details on what you are trying to do to give you a more detailed answer.
You can start a topic no our forum and attach your data/file.
Regards
Phil
This is GREAT solution! How would you add seconds to this calculation?
Hi Brad,
You can modify/add code to calculate seconds like this
VAR _mins = ROUNDUP((_hrs - hrs) * 60, 2)VAR mins = INT(_mins)
VAR seconds = INT((_mins - mins) * 60)
RETURN
//Use FORMAT to FORMAT the string to use 2 chars e.g. 03 rather than just 3
days & " d " & FORMAT(hrs,"00") & " h " & FORMAT(mins,"00") & " m " & FORMAT(seconds,"00") & " s"
Download this PBIX file that includes this code.
Regards
Phil