
Turning a PDF general ledger into a usable financial model has traditionally been a slow, manual process.
First, you need to extract the transactions accurately. Then you need to clean dates, preserve account codes, check that debits and credits balance, map accounts into reporting categories, build linked financial statements, and make sure the final model remains useful when new data is added.
That is before you even start building a forecast.
In this tutorial, I will show you how I used Tracelight, an AI-powered Excel add-in, to turn a 12-month PDF general ledger into this dynamic formula driven P&L, Balance Sheet, and interactive forecast dashboard:
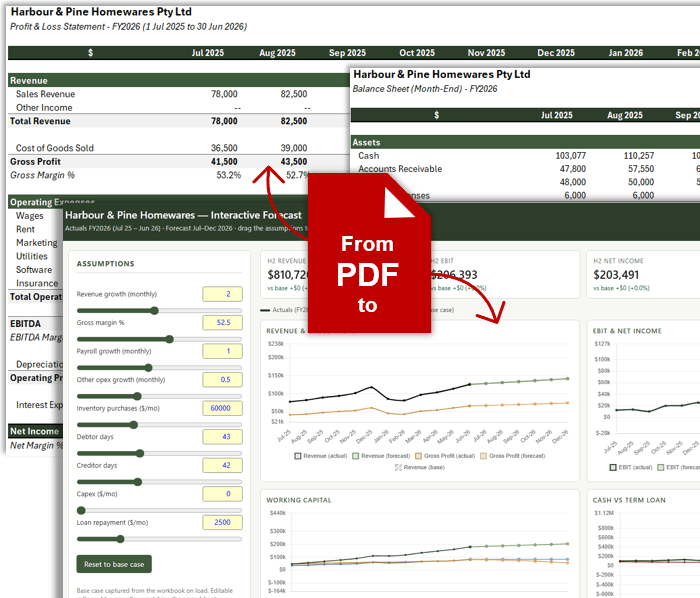
I will also cover two important parts of the financial modelling workflow that are easy to overlook: tracing formulas and auditing model errors.
Get a free Tracelight trial here.
Disclosure: Tracelight sponsored the related video. This article is based on the workflow demonstrated in that video. As with any AI-generated financial model, the output should be reviewed carefully before it is used for management, investment, tax or statutory reporting decisions.
Table of Contents
- Watch the Excel AI Video
- Try it Yourself with the Practice Data
- The starting point: a 12-month general ledger PDF
- Step 1: Import the PDF general ledger into Excel
- What to check after importing the PDF
- Why source traceability matters in financial models
- Step 2: Build a P&L, Balance Sheet and management dashboard
- The account-mapping table
- The monthly Profit and Loss statement
- The Balance Sheet and reconciliation checks
- Building a management dashboard from the financial model
- Step 3: Trace formulas and understand how calculations work
- Step 4: Convert the model into an interactive forecast app
- Step 5: Audit the financial model for errors
- Step 6: Compare two Excel workbooks to find changes
- Final thoughts & Free Trial
- Best practices when using AI for financial modelling
- Frequently asked questions
Watch the Video

Get the Example File
Enter your email address below to download the free file.

The starting point: a 12-month general ledger PDF
For this example, I started with a general ledger exported as a PDF:
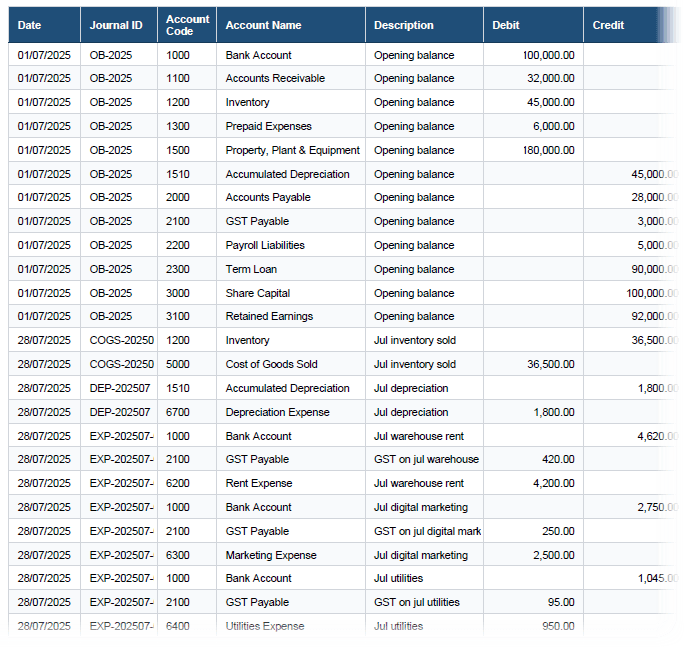
The file contained 12 months of transactions, from July 2025 to June 2026, across 11 pages.
The challenge was not just to extract the data. I also wanted to create a financial model that would update as new general ledger rows were appended making it part of an ongoing reporting process.
Step 1: Import the PDF general ledger into Excel
After installing Tracelight from the Excel Add-ins library and signing in, it opens in a task pane on the right side of Excel:
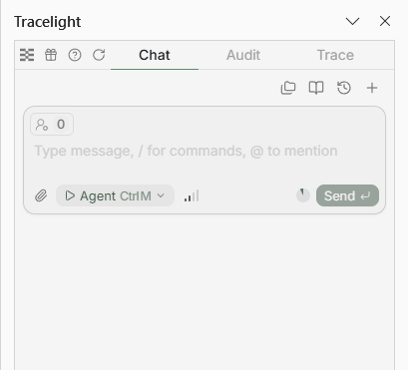
You can drag a PDF into the task pane and give Tracelight a clear instruction about how the data should be imported.
Here is the prompt I used:
Import the attached general ledger PDF and convert it into a clean structured table. Preserve all columns. Where journal identifiers are available, check that each journal balances, and flag any extraction ambiguity rather than guessing.
There are several useful parts of this prompt.
First, it asks Tracelight to preserve all columns. That reduces the risk of losing information that may be important later, such as journal IDs, reference numbers or account descriptions.
Second, it tells the tool to check that journals balance where possible. This is an important control because a PDF extraction can look correct at first glance while still containing shifted or missing values.
Third, it asks the tool to flag uncertainty rather than guessing. This is a good principle when working with AI and financial data. It is better to review an ambiguous transaction than to have an incorrect value inserted quietly into a financial model.
What to check after importing the PDF
Once the ledger has been imported, do not assume the data is correct simply because it appears in a neat table.
Review the following areas:
- Are dates stored as real Excel dates?
- Are account codes preserved as text where leading zeros matter?
- Do debit and credit totals balance?
- Are transaction descriptions complete?
- Have journal IDs been retained?
- Are there missing rows at page breaks?
- Have negative numbers, brackets and commas been interpreted correctly?
- Are there duplicate transactions?
- Are opening balances or prior-period balances included where required?
In this example, the imported dates used the DATE function, which meant they behaved as proper dates in Excel:
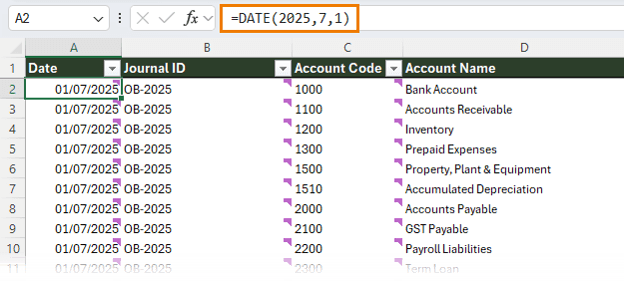
They could therefore be sorted, filtered, grouped and used in formulas without needing extra cleanup.
The account codes were also stored as text, preserving leading zeros that could otherwise be lost during an import.
Tracelight also created balance checks to confirm that debits and credits reconciled:
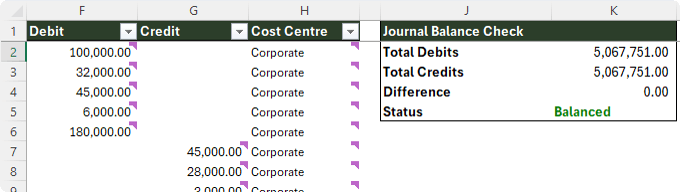
This is one of the most useful controls in a financial modelling workflow because it immediately highlights whether the imported transaction data is internally consistent.
Why source traceability matters in financial models
A financial model is much easier to trust when you can trace a value back to its original source.
In the imported ledger, each cell included source documentation:
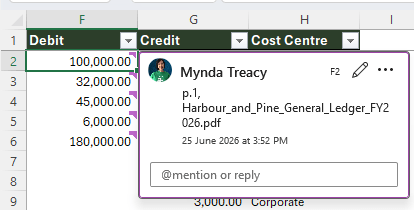
Tracelight also allowed the selected Excel cell to be highlighted in the original PDF source:
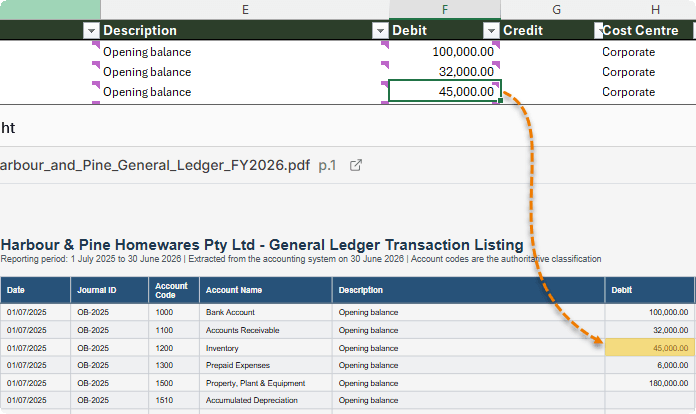
That is useful when reviewing a transaction because it creates a direct path from the model back to the original document.
For example, if an account balance looks unusual, you can inspect:
- The financial statement value
- The formula used to calculate it
- The ledger transactions contributing to the result
- The relevant entry in the original PDF
This is much more robust than receiving a completed spreadsheet with no clear explanation of where the numbers came from.
Step 2: Build a P&L, Balance Sheet and management dashboard
Once the general ledger had been cleaned and checked, I used a second prompt to build the financial statements and dashboard.
Use the cleaned general ledger to build a monthly Profit and Loss statement and Balance Sheet for the year ended 30 June 2026.
Create an account-mapping table, reconcile all outputs to the ledger, and create a one-page management dashboard with revenue, gross profit, operating profit, cash, receivables, inventory, payables, debt, and monthly trends.
Use formulas, structured references and dynamic ranges wherever appropriate. Do not hard-code financial statement values. The reports must update automatically when new general ledger rows are appended to the cleaned ledger table.
This prompt is deliberately detailed because it defines both the outputs and the modelling standards.
The last instruction is especially important.
If the model relies on hard-coded values or fixed cell ranges, it may look correct today but fail as soon as new transactions are added. Using Excel Tables, structured references and dynamic formulas helps the model remain useful over time.
The account-mapping table
The first output was an account-mapping table:
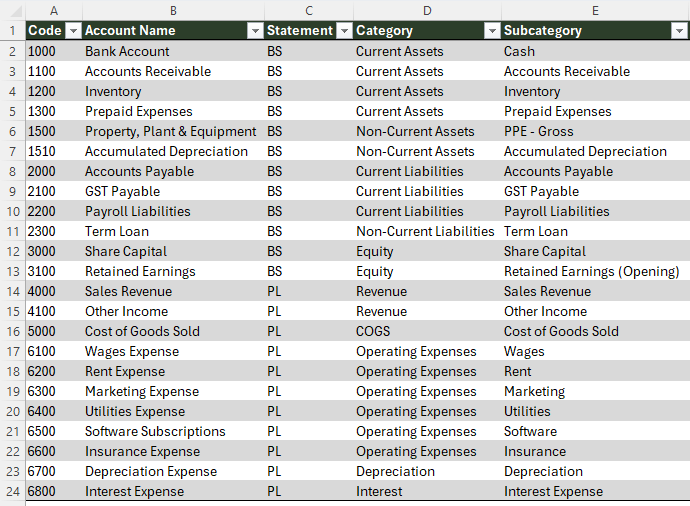
This classified each account as belonging to either the Balance Sheet or Profit and Loss statement. It then assigned categories and subcategories such as revenue, cost of sales, operating expenses, cash, receivables, inventory, payables and debt.
Account mapping is one of the areas that should always be reviewed by someone who understands the organisation's reporting requirements.
For example, a business may classify certain costs differently depending on its internal management reporting policies. The mapping produced by AI can provide a strong starting point, but it should not replace accounting judgement.
Before relying on the statements, review:
- Whether revenue accounts are classified correctly
- Whether direct costs have been separated from operating expenses
- Whether payroll and contractor costs are reported consistently
- Whether fixed assets, inventory and prepaid expenses are classified appropriately
- Whether loans and other liabilities are split correctly between current and non-current balances
- Whether tax-related accounts need separate treatment
- Whether retained earnings and equity balances reconcile correctly
The monthly Profit and Loss statement
The Profit and Loss statement was built using SUMIFS formulas linked to the general ledger table and the month headers:
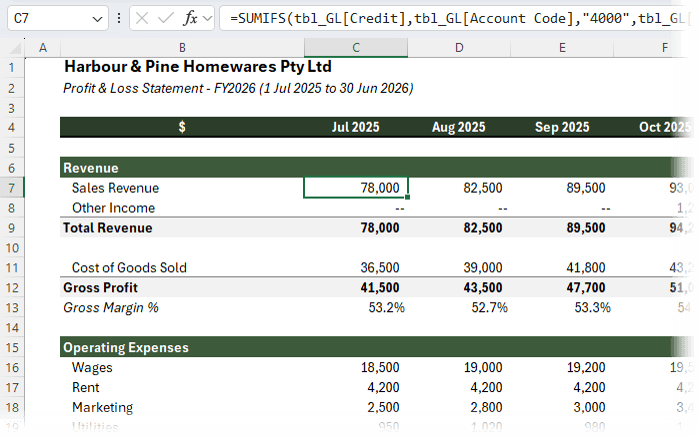
This is a good modelling approach because it creates a clear relationship between the source data and the report.
For example, a monthly revenue calculation might use logic similar to this:
=SUMIFS(
    GeneralLedger[Credit],
    GeneralLedger[Category], $A10,
    GeneralLedger[Date], ">="&C$4,
    GeneralLedger[Date], "<="&EOMONTH(C$4,0)
)
The exact formula will depend on the structure of the ledger and the treatment of debits and credits, but the principle remains the same.
The key is that the result comes from the ledger data rather than being typed manually into the statement.
The P&L also included useful financial metrics such as:
- Gross Margin %
- EBITDA Margin %
- Net Margin %
These metrics make the report more useful for management because they turn raw financial statements into performance indicators.
The Balance Sheet and reconciliation checks
The Balance Sheet followed the same linked structure, with formulas pulling values from the ledger and supporting calculations:
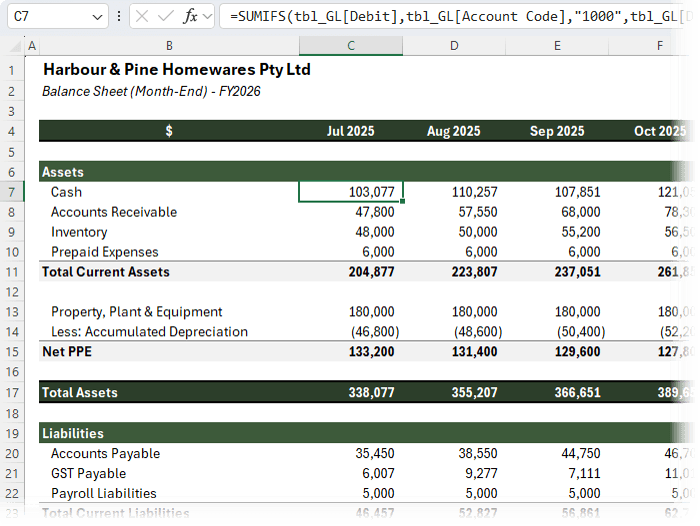
A well-built Balance Sheet should include a reconciliation check confirming that:
Assets = Liabilities + Equity
This is one of the most important checks in the model.
If the Balance Sheet does not balance, the issue may come from:
- An incorrect account mapping
- Sign errors
- Missing opening balances
- Retained earnings not rolling forward correctly
- Transactions classified in the wrong statement
- A formula that excludes one or more accounts
- An incorrect treatment of depreciation, inventory or loan movements
It is important to note that a general ledger extract must include sufficient information to support an accurate Balance Sheet.
For example, if you only have current-period movements without opening balances, you may be able to build a useful P&L but not a complete Balance Sheet. In that situation, you would also need opening balances, a trial balance or other balance-sheet information.
Building a management dashboard from the financial model
The dashboard consolidated key financial metrics into a one-page management view:
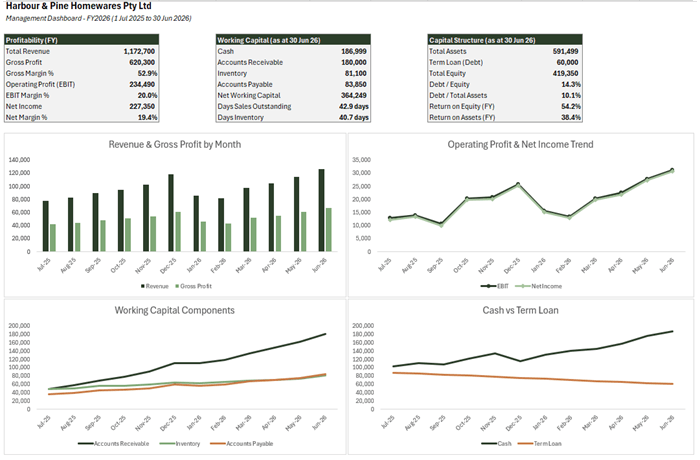
Which was a great starting point to develop the forecast in step 4.
Step 3: Trace formulas and understand how calculations work
When AI helps build a financial model, you still need to understand the logic behind the outputs.
This is where Tracelight's Trace feature is useful.
With a cell selected, you can inspect the formula, view a plain-English explanation of what it calculates, see how the components evaluate and review the labels that provide context for each reference:
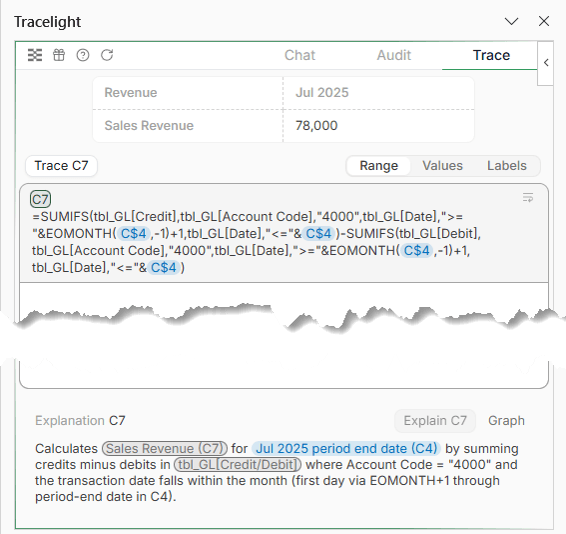
You can then use the arrow keys and Enter to navigate through the formula arguments and drill into precedent cells.
This makes it easier to review an AI-built model without manually searching through long formulas and multiple worksheets.
Step 4: Convert the model into an interactive forecast app
Once the historical P&L, Balance Sheet and dashboard were in place, the next step was forecasting.
I used the following prompt:
Convert the management dashboard into an interactive Spreadsheet App with a monthly forecast from July to December 2026.
Use the latest actual monthly results as the forecast baseline. Add editable assumptions for revenue growth, gross margin, payroll growth, operating expense growth, inventory purchasing, debtor days, creditor days, capital expenditure and loan repayments.
Allow users to adjust these assumptions and see the forecast P&L, cash balance, working capital and key dashboard charts update instantly. Clearly separate actuals from forecast, show the assumptions panel prominently, and include a base-case scenario by default.
This prompt tells the tool to create a forecast that is based on current results while giving users control over the assumptions that are likely to drive future performance.
The completed forecast was converted into an interactive spreadsheet app:
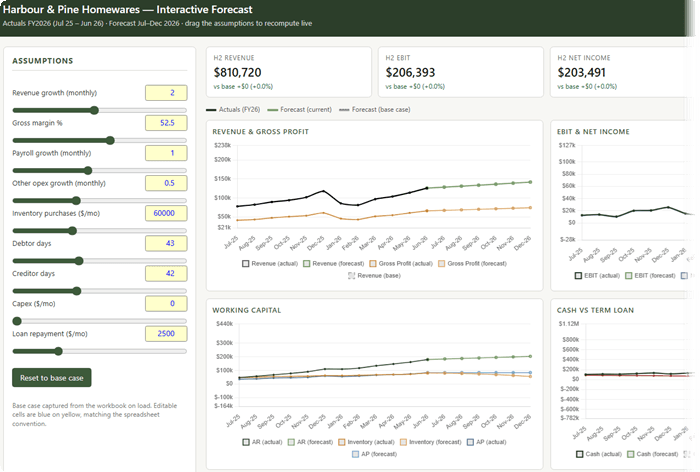
This allowed users to adjust assumptions through sliders and immediately see the impact on key dashboard metrics, charts, working capital and cash flow.
The layout included headline figures at the top, an assumptions panel on the left and interactive charts below.
Users could hover over chart points for tooltips and temporarily remove chart series by clicking the legend.
One important feature is that changes made in the browser do not write back to the original Excel workbook which protects the underlying formulas and source data.
Instead of emailing a full Excel workbook to every stakeholder, you can share a link to an interactive version of the model.
Step 5: Audit the financial model for errors
A financial model can look polished and still contain errors.
That is why auditing should be part of the modelling process, not something saved for the end.
In the demonstration, I opened a version of the workbook with several intentional errors and used Tracelight's Audit feature to run an error check.
The tool identified high-severity errors and documented them in the task pane:
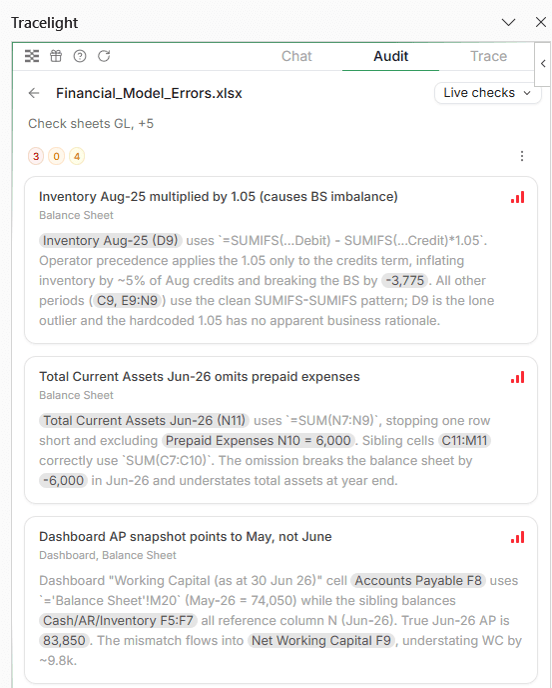
Clicking an issue navigated directly to the relevant cell.
The ability to identify the problem cell, review the formula and choose whether to fix it can save time during model reviews.
Step 6: Compare two Excel workbooks to find changes
Another useful feature in the workflow was workbook comparison.
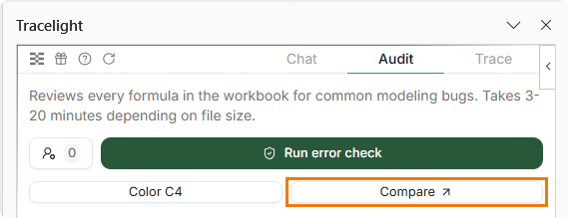
This allows you to upload two versions of an Excel workbook and identify differences between them.
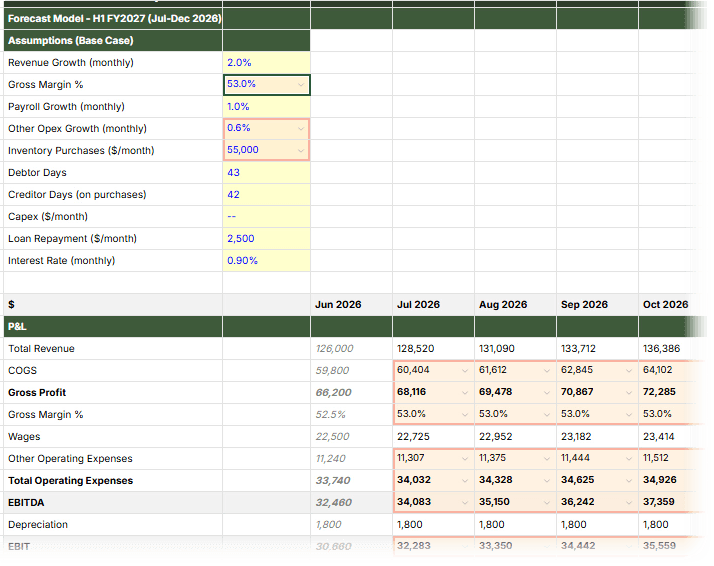
The comparison summary highlighted changed sheets, colour-coded changed cells and showed the previous value in red and the new value in green.
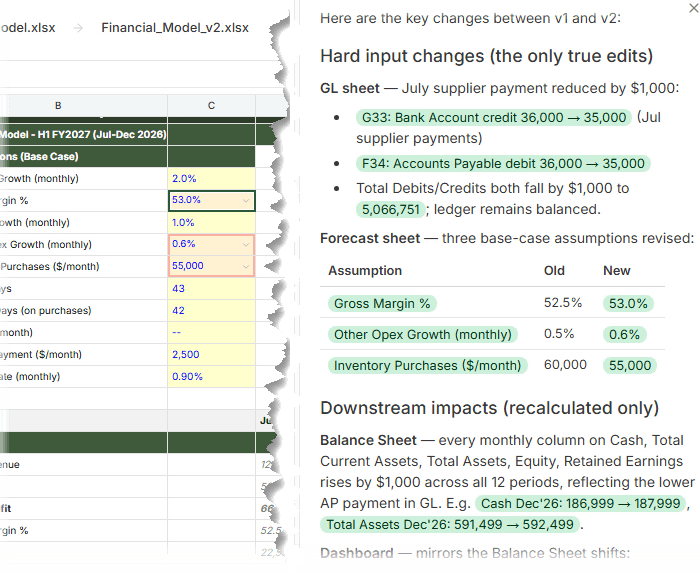
You could also switch on Computed Changes to identify cells affected by upstream changes which are shown in orange highlighted cells:
That is useful because a small change to a formula or assumption can affect dozens of calculations elsewhere in the model.
Final thoughts & Free Trial
The most valuable part of this workflow is not simply that AI can generate a financial model.
It is that the model can remain connected to the underlying transactions, use transparent formulas, include reconciliation checks, support forecasting and make the logic easier to inspect.
For finance professionals, consultants and anyone who spends time building or reviewing Excel models, that combination can be much more useful than receiving a one-off answer in a chat window.
A good financial model should be more than a set of outputs.
It should be traceable, auditable, adaptable and understandable.
To see how Tracelight can help you import financial data, build linked Excel models, audit formulas and turn forecasts into interactive spreadsheet apps, click here to try Tracelight.ai free.
Best practices when using AI for financial modelling
AI can accelerate financial modelling, but it should not remove the review process.
Here are several good practices to follow.
1. Start with clean source data
The quality of the output depends heavily on the quality of the input.
Check that the source ledger is complete, includes relevant opening balances and has clear account descriptions.
2. Ask AI to flag uncertainty
Do not ask the AI to guess when a PDF extraction is unclear.
Tell it to identify ambiguous rows, missing values or potential issues for review.
3. Use linked formulas rather than hard-coded results
A report that updates automatically is more useful than a one-off output.
Ask for Excel Tables, structured references, dynamic ranges and formula-driven statements.
4. Review account mappings carefully
AI can suggest an account mapping, but a finance professional should check that the classification aligns with the organisation's accounting and reporting policies.
5. Build reconciliation checks into the model
At a minimum, include checks for:
- Debit and credit totals
- Profit and Loss reconciliation
- Balance Sheet balance
- Cash movement
- Opening and closing balances
- Forecast consistency
6. Trace important outputs back to source transactions
You should be able to understand how key metrics, financial statement lines and dashboard figures were calculated.
7. Use scenario analysis rather than relying on one forecast
A forecast is more useful when you can compare base, upside and downside scenarios.
8. Audit before sharing
Run error checks, inspect unusual values and compare workbook versions before circulating financial models to stakeholders.
Frequently asked questions
Can AI convert a PDF general ledger into Excel?
Yes, AI tools can extract a PDF general ledger into a structured Excel table. However, the imported data should be checked carefully for missing rows, incorrect dates, misread values, duplicate transactions and debit-credit imbalances.
Can AI build a Profit and Loss statement from a general ledger?
AI can help create a Profit and Loss statement by mapping ledger accounts to reporting categories and using formulas such as SUMIFS to calculate monthly totals. The account mapping and final statements should still be reviewed by someone with financial knowledge.
Can you create a Balance Sheet from a general ledger?
You can create a Balance Sheet if the general ledger includes sufficient information, including opening balances and the movements needed to calculate closing balances. A current-period transaction extract alone may not be enough to build a complete Balance Sheet.
What is the best way to make a financial model update automatically?
Use Excel Tables, structured references, dynamic ranges and formulas that link directly to the source ledger table. Avoid hard-coding financial statement values.
Why are reconciliation checks important in financial models?
Reconciliation checks help identify missing transactions, incorrect account mappings, formula errors, sign errors and other problems before they affect reports or decisions.
Can stakeholders use an interactive forecast without editing the Excel workbook?
Yes. Spreadsheet apps can allow users to adjust assumptions and view results in a browser without changing the original workbook, formulas or source data.