Turn Your Data into Clear, Compelling Insights
Stop creating confusing charts - start communicating with impact.
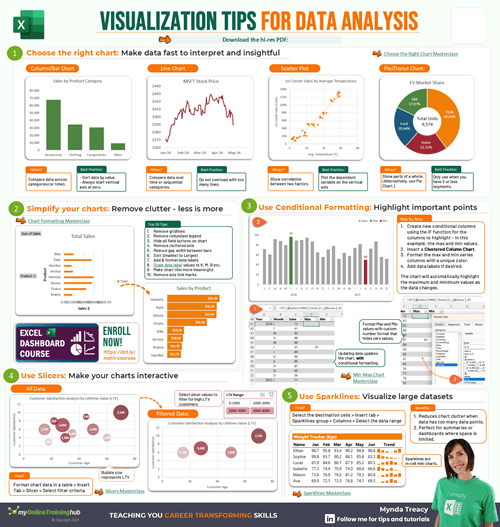
Data should tell a story, not cause confusion.
This cheatsheet gives you essential visualization techniques to ensure your charts are clear, insightful, and decision-ready.
With these expert tips, you'll be able to:
✔ Choose the right chart for your data every time
✔ Highlight key insights without clutter
✔ Design dashboards that are intuitive and easy to interpret
Better visuals mean better decisions
Download your free copy here
Enter Your Email Address
About The Author